BTC ETFs Shed $582M in a Day, Their Third Straight Session of Outflows
 Alex Carter

Three Things to Know
- US spot bitcoin ETFs logged a third straight day of outflows, and the daily losses grew each session.
- Bitcoin's daily RSI sits deep in oversold territory, yet momentum still points lower.
- A late June daily close now marks the line between a real recovery and another failed bounce.
Investors pulled more money from US spot bitcoin ETFs for a third session in a row. The exits accelerated each day as a wave of forced liquidations hit leveraged traders across crypto.
Those funds once bought steadily into every dip. Their retreat removes a key source of demand just as bitcoin trades at its weakest levels in over a year. Traders now want to know if buyers can defend recent lows without institutional support.
Institutional Money Heads for the Exit Three Days Running
US spot bitcoin ETFs posted a third straight session of net outflows on Nov 19, and the pace picked up each day. Funds shed about $240 million on Nov 17. Outflows rose to roughly $306 million the next day. The Nov 19 figure nearly doubled that, at about $582 million.
The three days added up to about $1.13 billion leaving the products. Total ETF assets dropped to around $76.6 billion on Nov 19. They stood near $105 billion in late October. Cumulative net inflows still stand near $53.5 billion, so most long-term holders have stayed put.
Leveraged traders were forced out at the same time. About $2.7 billion in crypto positions were liquidated in 24 hours, the 11th-largest such event on record, The Kobeissi Letter said. Bitcoin touched about $55,100 early Nov 21, its lowest level since September 2024.
No single external trigger has been confirmed. The Fear & Greed Index sat at 20, deep in extreme fear.
Bitcoin Trades Far Beneath Both Long Averages After a Steep Month
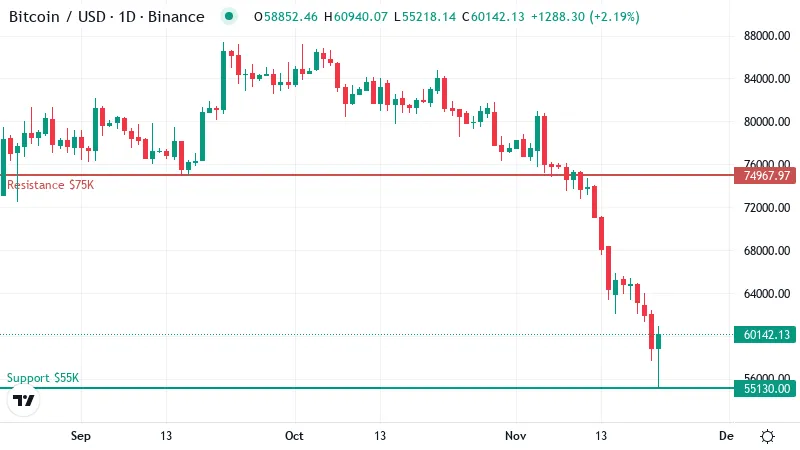
Bitcoin traded near $60,000 on the live data, about 2% higher on the day. Price recovered to about $60,135 by mid-afternoon UTC after the early slide. That bounce looks small against the damage of recent weeks.
The coin is down about 12% over seven days. Over 30 days the loss stretches to roughly 28%. A small daily gain barely dents a month like that, and buyers have yet to prove they can hold even modest recoveries.
Moving averages show the same picture. A moving average smooths out daily swings to show the underlying direction. Bitcoin sits well below its 50-day average near $74,000. Its 200-day average is close by, near $75,000. Both lines now act as ceilings, and price would need to climb about 25% just to test them.
Those two lines are packed close together overhead. That stacks resistance in one zone, the same area the daily chart marks with its red line. Trend-strength readings confirm a real trend, and sellers are the ones leading it.
Bitcoin peaked at about $126,080 on Oct 6, 2025. It now trades roughly 52% below that high. Half of the value built during the last rally has disappeared, and the selling shows no clear exhaustion.
Oversold Readings Have Not Yet Stopped the Selling
The momentum gauges tell a split story. RSI, a 0 to 100 gauge of momentum, sits near 22 on the daily chart. Anything below 30 counts as oversold, and this reading sits well under that line.
Readings this low often come before relief bounces, as sellers run out of fuel and short-term buyers hunt for value. Part of the move off the intraday low may reflect that pull.
MACD has not confirmed a turn, though. The indicator remains below its signal line, which means downside momentum is still in charge. A bounce without that crossover often fades.
Oversold markets can also stay oversold for weeks. In a strong downtrend led by sellers, a low RSI shows how hard price has fallen. It does not mark the bottom.
Why the June Close Matters More Than the Intraday Low
Closing prices carry more weight than intraday wicks. A brief dip can trap late sellers, but a daily close shows where buyers and sellers actually settled.
The nearest support on the daily chart sits around $55,000, right next to the intraday low. Nothing is mapped below it. A clean break there would leave price without a clear floor.
A more telling level is the June 30 close near $58,570. Bitcoin finished Nov 20 near $58,820, its lowest daily close in 90 days. That left only a thin cushion above the June mark. A daily close under it would turn the recent rebound into a simple bounce inside a falling market.
Overhead, the first resistance lines up with the long averages that now cap price. Reclaiming that zone would signal real trend repair. The next ceiling waits near $81,000.
Two Paths From an Oversold Floor
- Bullish: Bitcoin holds above the June close on a daily basis, and the oversold bounce stretches toward the zone where the 50-day and 200-day averages meet. A daily finish below that mark cancels this view.
- Bearish: A daily close under the June close opens a retest of the green support line near the intraday low. A reclaim of the long-average zone overhead would invalidate this path and point to real trend repair.
Sellers Keep Control Until the Funds Return
The rebound remains fragile while the ETF flows stay negative. Spot funds absorbed supply through earlier dips, and that steady bid has gone missing. Until daily flows turn positive again, rallies face sellers waiting to exit.
Bitcoin's bigger risk sits under its recent low. The chart maps no support below that green line, so a break there could accelerate quickly.
Disclaimer: This article is provided for informational purposes only. It is not offered or intended to be used as legal, tax, investment, financial, or other advice.
Disclaimer: This article is provided for informational purposes only. It is not offered or intended to be used as legal, tax, investment, financial, or other advice.
Related Stories