BTC Could Slide Toward $60K as Markets Price an 89% Chance of a December Fed Hike
 Alex Carter

Three Things to Know
- Bitcoin hit a three-month low after a hot October inflation report pushed traders to bet on a December Fed hike.
- The chart has turned bearish, with price stuck beneath both of its key moving averages and sellers setting the pace.
- One support zone near $63K now stands between Bitcoin and a deeper slide.
Bitcoin fell sharply after US consumer prices ran hotter than expected. Two Fed officials then pushed for higher rates, and traders abandoned bets on a December hold.
That shift hits Bitcoin where it hurts. A stronger dollar, rising yields and steady ETF outflows have drained demand for risk assets. Traders now want to know whether buyers will defend the next floor or let sellers drive the price much lower.
Hot CPI Flips the Fed From Hold to Hike
Bitcoin slipped about 1.2% to near $73,935 early on Nov 11, after hitting its lowest level in three months overnight. The trigger was a hotter-than-expected October US consumer price report. Two Federal Reserve officials, including Governor Christopher Waller, then called for higher rates.
Traders quickly dropped their bets on a hold. CME FedWatch now shows nearly 89% odds of a 25 bps hike in December, with a small chance of a larger move. The dollar and Treasury yields climbed on the shift, which tends to drain demand for risk assets.
Other pressures piled on. Spot Bitcoin ETFs kept bleeding outflows this week. Democrats also won both chambers of Congress in the midterms, raising fears of stricter rules on anti-money laundering and risk management.
History offers little comfort. Bitcoin lagged during the 2022-2023 hiking cycle. Altcoins fell harder this time, with Ether down 2.4% to $2,066.29. XRP lost 3.8% and Solana dropped 3.5%.
Bitcoin Trades Beneath Both Moving Averages
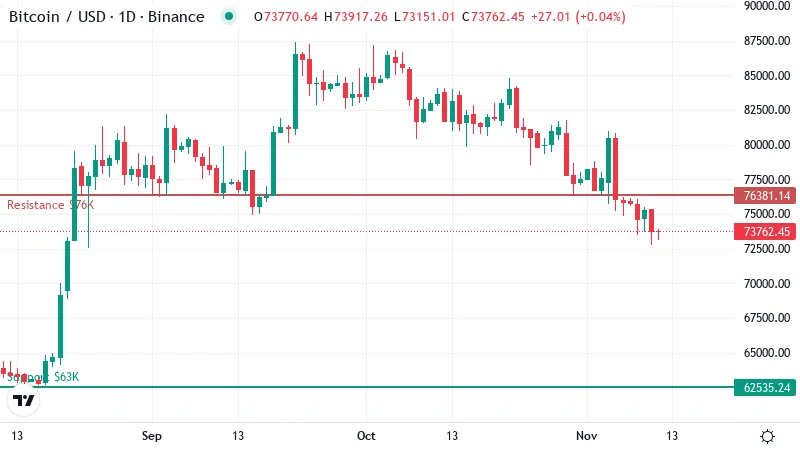
Bitcoin now trades near $74K, under both of the moving averages that traders watch most. A moving average smooths out daily swings and shows the trend over a set period. The 50-day average sits around $79K and tracks the short-term trend. The 200-day sits near $76K and tracks the broader trend.
Price below both lines is a bearish setup. Each average now acts as a ceiling that buyers must clear before any recovery looks real. The 50-day sits above the 200-day, so the 200-day is the first hurdle, just a few thousand dollars overhead.
The chart lines up with the rate story. Buyers have had little reason to step in while borrowing costs look set to rise.
Losses have built steadily. Bitcoin lost about 5% over the past week and roughly 12% over the past month. That leaves the price close to the bottom of its 30-day range, with few recent rebounds to show for the month.
Losing the 200-day line carries extra weight. Bulls had treated it as a cushion, and dips toward it used to draw buyers. With price now below it, that cushion is gone, and the line becomes resistance instead of support.
Sellers Keep the Upper Hand Without Capitulating
The daily RSI, a 0 to 100 gauge of momentum, sits near 34. That reading is weak, yet it stays above the oversold mark of 30. Sellers still have room to push lower before the market looks stretched enough to force a bounce.
Other momentum signals point the same way. The MACD, which tracks shifts in trend speed, remains below its signal line. That means downside momentum has yet to fade. Trend gauges also show a new downtrend taking shape, with sellers setting the pace.
There is no sign of panic, though. Capitulation usually brings a sharp flush on heavy selling, followed by a fast rebound. Bitcoin has seen neither so far.
Price ended the past 24 hours flat, which looks like a pause after the CPI shock.
Support Near $63K Guards the Path to $60K
The nearest support sits near $63K, well below the current price. The data shows no shelf between here and that floor. A break lower could run quickly because few buyers have defended the levels in between.
That gap explains the headline risk. A daily close below that floor would remove the last clear support on the chart. The $60K area would then become the next natural target, with momentum already pointing down.
Bulls have a clear task on the upside. Price first needs to reclaim the 200-day line overhead. That would turn the average back into a floor and ease the bearish setup. The next resistance stands near $80K, just above the 50-day average. That zone would likely cap any recovery, since sellers have used both levels to lock in exits during the recent slide.
What Flips the Next 72 Hours
Fed speakers and spot ETF flows will likely decide which path Bitcoin takes next.
- Bullish: A daily close above the 200-day line would turn that ceiling back into a floor. It would also open a run toward the upper resistance near the 50-day average. The setup fails if price slips back under today's trading level.
- Bearish: A rejection at the 200-day keeps sellers in charge and points toward the floor discussed above. A close back above the 200-day would cancel this view, since it would show buyers regaining control.
Rate Fears Hold the Wheel for Now
Until Bitcoin reclaims its 200-day average, the bias stays bearish.
Short sellers face their own risk, though. A softer inflation reading or a dovish remark from a Fed official could revive hopes of a hold. That shift could force bearish traders to cover quickly and spark a sharp squeeze higher.
Disclaimer: This article is provided for informational purposes only. It is not offered or intended to be used as legal, tax, investment, financial, or other advice.
Disclaimer: This article is provided for informational purposes only. It is not offered or intended to be used as legal, tax, investment, financial, or other advice.
Related Stories