BTC Bears Are Back in Control Near $76,000; Here's What Swing Traders Can Do Next
 Alex Carter

Three Things to Know
- Bitcoin dropped sharply as traders priced in a Democratic sweep of the US midterm elections.
- Momentum still favors sellers, and the coin trades below its 50-day average.
- The 200-day line near $76,000 now decides whether the long-term uptrend survives.
Bitcoin slid this week as election betting markets tilted toward Democratic control of Congress. Traders worry a sweep could slow the pro-crypto policy push that has supported prices for months.
The timing leaves the coin exposed. Bitcoin entered the vote already weak. Traders now watch whether buyers can defend the long-term trend line on election night.
Midterm Sweep Bets Knock Bitcoin to $75,700
Bitcoin briefly sank to $75,700 around Nov. 3, 2026, as bets on a Democratic sweep of the US midterm elections gained ground. The dip came quickly and erased gains that buyers had defended through late October.
Traders tied the selling to the political odds. Many fear that Democratic control of both chambers could stall or reverse the pro-crypto agenda now moving through Washington. That agenda includes market structure rules and friendlier oversight, which the industry has counted on for months.
The coin is down about 4% over the past week. That leaves it soft heading into a vote that markets cannot price with confidence.
Election headlines and shifting odds will likely move Bitcoin more than crypto news in the coming days. That adds event risk to a market already losing steam.
Bitcoin Slips Under Its 50-Day Line but Clings to the 200-Day
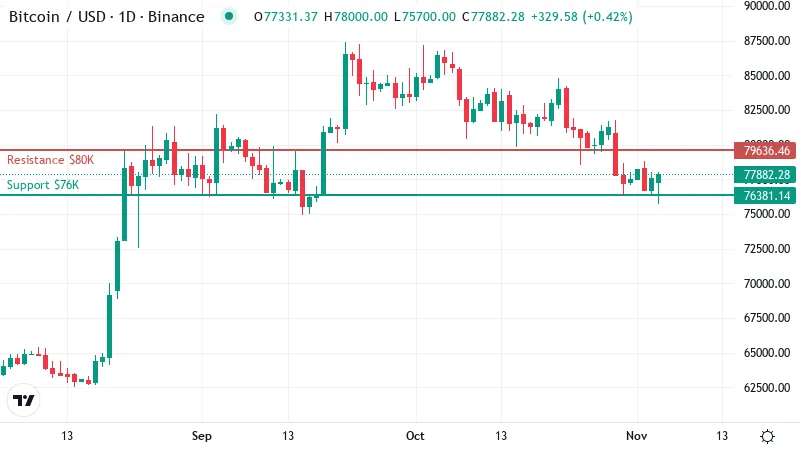
Bitcoin has clawed back some ground since that sharp dip. The coin now trades near $78,000, roughly unchanged over the past 24 hours. Buyers stepped in, but they have not pushed far.
The 50-day moving average sits around $80,000. A moving average smooths out daily price swings to show the underlying trend, and the 50-day tracks the past two months or so. With price below it, that line now works as a ceiling. Each bounce toward it is likely to meet sellers who want out near break-even.
Further down, the 200-day moving average rests near $76,000, just under the current price. That average tracks roughly the past year of trading, and Bitcoin still holds above it. In plain terms, the broader uptrend has taken a hit but remains intact.
That puts Bitcoin in a narrow pocket between two key lines. A move through either one would likely set the tone for the next several weeks.
The past month explains the caution. Bitcoin has lost about 10% over 30 days, a steady grind lower with few strong rebounds.
Today's quiet session after a sharp drop looks like a pause while traders wait for news. It does not yet show buyers taking charge.
Sellers Keep the Upper Hand as Momentum Fades
RSI, a 0 to 100 gauge of momentum, sits near 41 on the daily chart. That reading is weak, but it is still well above the oversold zone below 30. In practice, sellers have room to push further before the market looks stretched enough to force a bounce.
Momentum tells a similar story. The MACD, which compares short and longer price averages, remains below its signal line. That means downward pressure has not turned yet, and the recent stabilization has not carried enough force to flip it.
Trend strength adds a warning. The readings show a new trend starting to form, and sellers are the ones leading it. A forming trend can still fade, but this one is building in the bears' favor.
Swing traders have little reason yet to bet on a quick reversal.
Where a Break Sends Bitcoin Next
The first test sits at the 200-day line. That average doubles as the nearest support on the daily chart, and the election scare already pushed price to its edge. Buyers held it once. A second test would show whether that defense was real or just a pause.
A close below that floor would change the picture fast. The chart shows little support between there and the next level near $65,000. That leaves a wide gap where prior trading was thin, so a slide could pick up speed before buyers find firm footing.
The upside path runs through the 50-day line. If Bitcoin climbs back above it and holds, that ceiling would turn into a floor again. Sellers who have capped each bounce would lose their best spot to unload.
A reclaim would put the next resistance near $82,000 in view. That target is modest, but it would mark the first higher high since the selling began.
Two Paths Into the Election Count
Election results will likely pick the path. Each one has a clear trigger and an exit point.
- Bullish: A daily close back above the 50-day line would open a push toward the next resistance. The setup fails if price slips back under the 200-day average.
- Bearish: A daily close below the 200-day floor would point to a slide toward the deeper support. The setup fails if Bitcoin recovers above the 50-day ceiling.
Swing Traders Should Let $76K Decide
For now, the bias stays bearish while Bitcoin trades under the 50-day line. Long positions only make sense after a clean, confirmed reclaim of that ceiling.
Election night adds its own danger. Headlines can trigger sharp wicks through either level, shaking out stops before price settles. Swing traders should keep position sizes small until the vote count is clear.
Disclaimer: This article is provided for informational purposes only. It is not offered or intended to be used as legal, tax, investment, financial, or other advice.
Disclaimer: This article is provided for informational purposes only. It is not offered or intended to be used as legal, tax, investment, financial, or other advice.
Related Stories