Bitcoin Price Slide Hints at a 16% Drop as Holders Weigh Year-End Tax-Loss Sales
 Alex Carter

Three Things to Know
- Bitcoin holders can still sell at a loss and buy straight back, because crypto has no wash-sale rule yet.
- The coin trades under both its 50-day and 200-day averages, with momentum still pointing down.
- A wide gap separates the price from the nearest support floor, and that zone near $63K is drawing attention.
Bitcoin investors sitting on paper losses have a year-end option that stock traders lack. They can sell, book the loss for taxes and buy the coin back the same day.
That window matters now because the coin keeps sliding and Congress is weighing bills to close the gap. Traders want to know whether tax-driven selling into December will push bitcoin to its next floor before buyers step in.
Missing Tax Rule Turns Bitcoin Losses Into a Year End Play
The IRS has treated digital assets as property since Notice 2014-21. Section 1091, the wash-sale rule, covers only stock and securities. That means a holder can sell bitcoin at a loss, buy it back right away and still claim the loss.
The losses are large this year. BTC traded near $75,662 on Nov 8. That was about 40% below its record of $126,080, set on Oct 6, 2025. Ether sat about 55% off its peak, XRP about 68% and Solana about 70%.
Here is how the math works. Someone who bought one bitcoin at the top and sold on Nov 8 would book a loss near $50,418. Set against long-term gains taxed at 15%, that cuts the federal bill by roughly $7,560. Losses beyond gains offset up to $3,000 of ordinary income a year, and the rest carries forward. Buying back resets the cost basis and restarts the holding period.
There are limits. Spot ETFs such as BlackRock's IBIT are securities, so the wash-sale rule applies to them. Tax advisers also flag the economic-substance doctrine and state rules as possible traps.
The window may not last. Sen. Steve Daines introduced S. 5616, the ADAPT Act, which now sits with the Senate Finance Committee. A House bill, H.R. 10357, cleared the Ways and Means Committee 38-5. Its proposed start date of Sept 14, 2026 could apply the rule retroactively. Sales must settle by Dec 31 to count for 2026.
Bitcoin Slips Under Both Averages as the Month Bleeds Lower
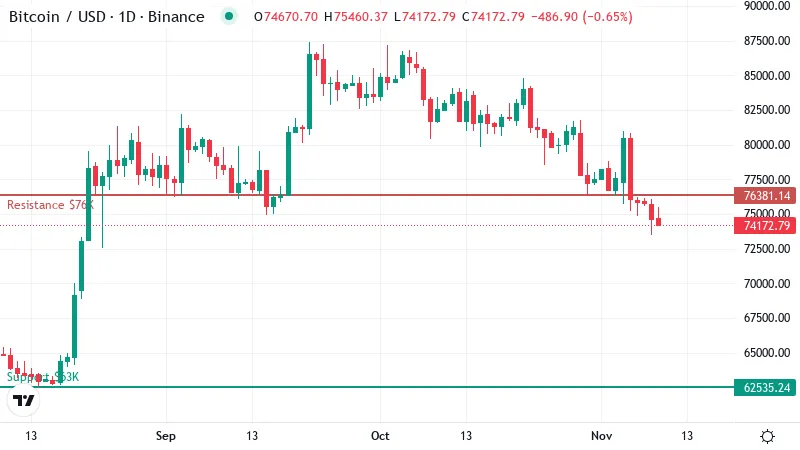
Bitcoin traded near $74K on Monday, little changed over the past 24 hours. The quiet day comes after steady losses. The coin is down about 5% over the past week and about 10% over the past month.
The market keeps leaking lower, and each bounce has faded. Tax selling gives holders one more reason to sell into that weakness.
Moving averages tell the same story. This kind of average smooths out daily swings by tracking the average closing price over a set period. Bitcoin now sits below its 50-day average near $79K. It also trades under its 200-day average near $76K.
That alignment matters for readers watching the trend. When price trades under both lines, each one tends to act as a ceiling on rallies. Buyers would need to push back above the 200-day line first, then clear the 50-day, before the picture improves.
The 50-day average also sits above the 200-day. That means the recent slide has not yet dragged the shorter average under the longer one. A cross of that kind would confirm the weakness on a longer time frame.
The flat session reads as a pause. The coin has not reclaimed any level that would signal a turn.
Sellers Keep the Momentum Without Reaching Exhaustion
RSI, a 0 to 100 gauge of momentum, sits near 34 on the daily chart. That reading is weak. It shows sellers have controlled most recent sessions.
The gauge has not yet dropped below 30, the zone traders call oversold. Readings there often signal that selling is exhausted. Bitcoin has not reached that point, so prices still have room to fall.
Other momentum measures agree. The MACD, which compares short and longer price trends, remains below its signal line. In plain terms, downside momentum is still building rather than fading.
Trend strength readings show a downtrend taking shape, with sellers in the lead. Until that shifts, rallies are likely to meet supply from holders keen to lock in losses before the deadline.
Why $63K Is the Floor Everyone Is Watching
The daily chart shows a wide gap below the current price. The nearest support sits near $63K, where two levels overlap. Bitcoin has no closer cushion to catch a slide.
A fall to that zone would take the coin about 16% below where it trades now. With momentum still weak and tax sellers active into December, that level is the obvious target if the slide continues.
Overlapping support tends to draw buyers, so that floor is the line most likely to slow a decline.
Above, the first test is the 200-day average, which now acts as nearby resistance. Closing a session back over that line would ease the pressure. The next hurdle sits near $80K, just above the 50-day average. Clearing it would show buyers have taken back control.
Two Paths Before the Tax Deadline Pressure Builds
Bitcoin faces two clear setups as December approaches.
- Bullish: A daily close back above the 200-day average would open a run toward the hurdle just over the 50-day line. A drop below Monday's trading level would cancel that setup.
- Bearish: A failed retest of the 200-day line, plus steady tax-loss selling, would send the coin toward the double support floor. A close above the upper hurdle would invalidate this view.
Bears Hold the Edge Until $76K Falls
The chart and the tax calendar point the same way. Sellers hold momentum, and holders have a clear reason to book losses before Dec 31. That leaves the near-term bias tilted lower.
Two things could change that quickly. A retroactive wash-sale law would remove the incentive to sell and rebuy. A sharp rebound could also push holders to wait.
Disclaimer: This article is provided for informational purposes only. It is not offered or intended to be used as legal, tax, investment, financial, or other advice.
Disclaimer: This article is provided for informational purposes only. It is not offered or intended to be used as legal, tax, investment, financial, or other advice.
Related Stories