Bitcoin Price Edges Closer to a 9% Drop as ETF Outflows Top $1 Billion Again
 Alex Carter

Three Things to Know
- Spot Bitcoin funds logged another week of outflows above a billion dollars.
- Daily momentum looks oversold, yet sellers still control the trend.
- The nearest support floor sits about 9% below the current price, with little beneath it.
Investors pulled money from US spot Bitcoin ETFs for a second straight week. Corporate buying from Strategy Inc. has done little to offset the selling.
That matters because fund flows have driven much of this year's price action. Fear now grips the market, and a possible Fed rate hike looms in December. Traders want to know whether oversold conditions spark a bounce or the slide reaches the next floor.
Second Billion Dollar Week of ETF Exits Deepens the Slide
The funds shed about $1.07 billion between Nov 9 and 13, SoSoValue data show. Big funds are pulling money out faster than new buyers step in.
Strategy Inc. kept buying through the drop. The company added 485 BTC in the week to Nov 15, a purchase worth roughly $31 million. Its stash now stands at 850,849 BTC, bought at an average cost near $75,450. That leaves the firm sitting on about $10 billion in paper losses.
Mood across the market has soured. The Fear and Greed Index reads 22 out of 100, deep in fear territory. Bitcoin now trades about 50% below its October 2025 record near $126,000.
The Federal Reserve adds another worry. Markets expect a rate hike on December 9, which tends to hurt assets that pay no yield. Long-term holders see value at these prices. Short-term traders may wait until flows steady after the Fed decides.
Bitcoin Trades Far Beneath Both Averages After a 22% Monthly Slide
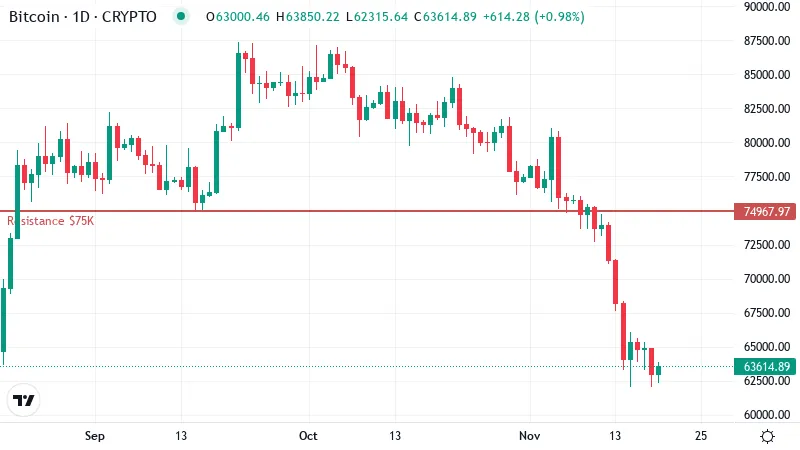
Bitcoin trades near $64,000, far below the levels where it spent most of the autumn. The daily chart shows a market that has stepped down in clear stages, with each bounce fading before it could build.
Moving averages smooth out daily noise and show the broader direction of price. The 50-day average sits around $75,000. The 200-day average is slightly higher, near $76,000. Bitcoin trades well under both lines. That gap confirms a downtrend on short and long time frames alike.
The two averages now act as a ceiling. Buyers who bought near those levels may sell to break even if price climbs back. That supply makes any recovery toward the mid-$70,000s harder to sustain.
Losses have also picked up speed. Bitcoin fell about 14% over the past week. Over the past month it dropped roughly 22%. More than half of the monthly decline came in the last seven days. Sellers grew more aggressive as November went on, which lines up with the heavy fund exits.
The last 24 hours brought a break from that pressure. Price finished the day roughly flat, with no fresh lows and no real bounce. Quiet days like this often follow a steep run lower as sellers catch their breath. Buyers have yet to take control, and one calm session does little to change the broader trend.
Oversold Readings Have Not Stopped the Sellers
RSI, a 0 to 100 gauge of momentum, sits near 24 on daily candles. Readings below 30 count as oversold. That tells traders the drop has run far and fast, and a relief bounce could come at any time.
Other signals still favor the bears. The MACD line remains below its signal line, so momentum keeps pointing down. Trend strength readings also show a real trend, and sellers are the ones driving it.
Oversold conditions can last for weeks when a downtrend is this firm. Price can keep sliding while RSI stays pinned low. A turn would need RSI to climb back above 30 and momentum to flip upward. Until then, the stretched reading signals exhaustion risk for sellers and offers no clear buy signal.
$58K Is the Floor Standing Between Bitcoin and Open Air
Nearest support sits near $58,000, the first real floor on the price chart. Buyers stepped in there before, so it should draw some demand on a retest.
The trouble lies beneath it. The data shows no clear next support if that level gives way. A clean break could leave price with little to slow the fall, and selling could speed up as stop orders trigger.
Any recovery faces its first test at the 50-day line, where the nearest resistance also sits. A push back to that zone would erase most of this week's damage. Sellers will likely defend it.
The bigger ceiling sits near $80,000. A daily close above that mark would show buyers back in charge. It would be the first sign the downtrend is turning.
What Flips the Next Three Days
- Bullish: Oversold momentum sparks a relief rally that carries price back toward the 50-day line, where the first resistance sits. A daily close under that support floor would cancel this view and hand control back to sellers.
- Bearish: Another week of heavy ETF exits drags Bitcoin down to retest the floor flagged above. A recovery above the 50-day line would undo this case and show the selling has run its course.
Stretched but Not Yet Bottomed
Sellers still set the pace. A lasting bottom likely needs fund flows to turn positive first. Until then, bounces may fade under the averages.
The Fed meeting is the main risk. A hike could push nervous holders to sell, and that pressure could crack the support floor.
Disclaimer: This article is provided for informational purposes only. It is not offered or intended to be used as legal, tax, investment, financial, or other advice.
Disclaimer: This article is provided for informational purposes only. It is not offered or intended to be used as legal, tax, investment, financial, or other advice.
Related Stories