Bitcoin Could Surge to $500K by Mid-2029, Investor Says, Even as Sellers Eye $60K
 Alex Carter

Three Things to Know
- Investor James Lavish says Bitcoin could reach as much as $500,000 by mid-2029.
- Bitcoin trades below both its 50-day and 200-day averages, and momentum still favors sellers.
- The 200-day average is the line buyers must reclaim before any longer climb can begin.
The call lands while the chart points the other way. Bitcoin has slid for weeks, and sellers are eyeing lower ground.
James Lavish Puts a $500,000 Ceiling on Bitcoin by Mid-2029
James Lavish, an investor known for his long-term bullish view on Bitcoin, says the largest cryptocurrency could climb to "as much as $500,000" by mid-2029. He framed the figure as an upper bound and gave no specific conditions for reaching it.
His case rests on a multi-year horizon. Lavish is betting that Bitcoin's long-run adoption trend outweighs short-term swings.
Today's chart sets a high bar for that view. Bitcoin trades near $73K, so the target sits roughly 585% above the current price. In plain terms, the coin would need to grow nearly sevenfold in about three years.
Nearer hurdles come first. Buyers must reclaim $76K and then $80K before the longer climb can start to take shape. A drop below $63K would weaken the bull case in the near term.
Bitcoin Trades Under Both Averages After a 10% Monthly Slide
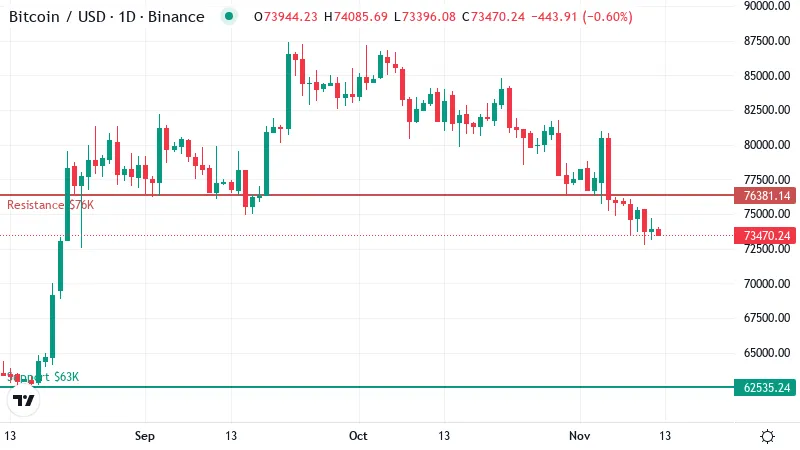
Bitcoin has lost about 9% over the past week and roughly 10% over the past month. The losses came steadily and dragged the price under both of its main trend gauges.
A moving average smooths out daily swings by tracking the average closing price over a set number of days. The 50-day average, now near $79K, reflects the recent trend. The 200-day average reflects the longer one. Bitcoin sits below both, which means each line now acts as a ceiling rather than a floor.
The 200-day line matters most right now. It sits at the same level as the first resistance noted above, so one zone carries two signals. A daily close above it would show buyers can hold ground the market has treated as fair value for most of the past year.
Trading over the past 24 hours was flat. That calm hints at a pause after a heavy week, though a pause alone does not reverse a trend.
Sellers Still Steer Momentum Despite a Stretched RSI
RSI, a 0 to 100 gauge of momentum, reads 34 on the daily chart. That reading is weak, though it stays above the oversold line at 30. Sellers still have room to push lower before the market looks stretched to the downside.
Other momentum signals lean the same way. MACD still points down, and trend strength readings show sellers in the lead.
Buyers would need volume to lift RSI back toward the neutral middle of its range. Until then, any bounce looks like a breather inside a falling trend.
$63K Is the Floor Between Bitcoin and the $60K Target
Bitcoin's nearest floor is the support level flagged at the top of this report. The data shows no second support close below it. That gap matters, because a clean break would leave little to slow a slide toward the $60K area that sellers are watching.
Overhead, the path stays crowded. The first ceiling sits at the 200-day average, and the next lines up near the 50-day line.
A close above that upper zone would change the picture. It would put Bitcoin back above both averages and flip the medium-term trend in favor of buyers.
What Flips the Next 72 Hours
Two triggers should decide the next move.
- Bullish: A daily close above the 200-day average would open a run toward the 50-day line. That setup fails if Bitcoin slips back under today's trading level, which would show buyers could not hold the breakout.
- Bearish: A daily close below the support floor would clear a path toward the round number sellers are eyeing. A reclaim of the 200-day average would cancel that scenario and put buyers back in control.
A Distant Target Meets a Weak Tape
Lavish's call is a multi-year thesis, and today's chart can neither confirm nor refute it. Sellers hold the edge until Bitcoin climbs back over its 200-day average.
A break of the support floor would deepen the drawdown and test the patience of long-term holders first.
Disclaimer: This article is provided for informational purposes only. It is not offered or intended to be used as legal, tax, investment, financial, or other advice.
Disclaimer: This article is provided for informational purposes only. It is not offered or intended to be used as legal, tax, investment, financial, or other advice.
Related Stories