ADA Pullback Likely to Trigger a Breakdown to $0.11 as Midnight's NIGHT Draws the Bids
 Alex Carter

Three Things to Know
- Cardano has lost its June floor while Midnight's NIGHT token keeps drawing fresh money away from ADA.
- Momentum indicators flash oversold, yet sellers still control a trend that shows no sign of fatigue.
- Traders are watching one last mapped shelf near $0.12, with no clear support beneath it.
Cardano broke below its summer low this week as sellers extended a steep autumn slide. Capital keeps rotating toward Bitcoin and toward Midnight, a sister chain whose token design adds no direct demand for ADA.
That leaves ADA short of buyers just as its chart turns fragile. Traders now watch whether a deeply oversold reading sparks a relief bounce or the selling pushes the coin below its final floor.
Midnight Rallies While Cardano Slides to Its Summer Floor
The token now trades roughly 95% below its all-time high of $3.09, set in September 2021. It has also lost about 54% since January, when it changed hands near $0.33.
Sellers drove ADA down to the one-year low of $0.144 from June 28. That level had held for months, and buyers have so far failed to defend it.
Money is flowing elsewhere within Cardano's own family. Midnight, a privacy chain built on Cardano technology, launched on March 30, 2026. Its fees are paid in DUST, which users generate by holding the NIGHT token. That design means Midnight's growth creates no direct demand for ADA.
The split showed in October. NIGHT rose 40% over 30 days, while ADA fell nearly 18%.
Bitcoin keeps pulling capital away too. Its market dominance stood at 59.5% in late October, a sign investors still favor BTC over altcoins.
Both Moving Averages Now Sit Overhead as the June Low Gives Way
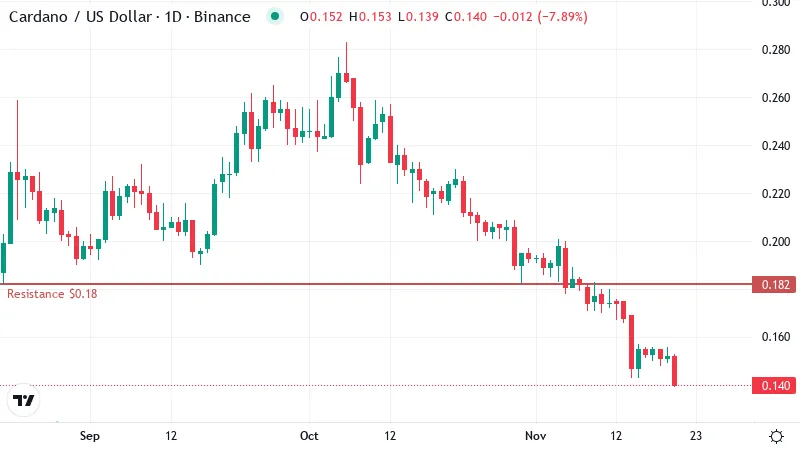
ADA now trades near $0.14, below the June floor. The token lost about 8% in the past 24 hours alone. That move turned a test of support into a clean break.
The weekly picture looks worse. ADA has shed roughly 20% over seven days, a steep drop for a top-20 coin.
October's recovery attempt has now vanished. ADA peaked near $0.225 on Oct 21, then slid steadily for the rest of the month. The past 30 days show a loss of about 37%, wiping out the entire bounce and then some.
Both key moving averages now sit above the price. A moving average smooths daily prices to show the underlying trend. The 50-day average stands near $0.19, which means recent buyers are mostly holding losses. Many of them may sell into any rally back toward that line.
The longer view offers no comfort. The 200-day average sits near $0.22, which puts the long-term trend firmly against ADA. When price trades under both lines, traders read it as a confirmed downtrend.
That 50-day average now works as a ceiling. ADA would need a rally of more than a third just to touch it.
Oversold Yet Still Sinking
The daily RSI, a 0 to 100 gauge of momentum, has dropped to about 25. Readings below 30 count as oversold, meaning sellers have pushed price down faster than usual. Such stretched readings often spark short relief bounces as late sellers run out of supply.
An oversold reading does not mark a bottom on its own. In strong downtrends, RSI can stay pinned in that zone for days or even weeks. Price can keep falling the whole time.
Other gauges show no sign of seller fatigue yet. The MACD, a tool that tracks shifts in momentum, still sits below its signal line. That means downward momentum has not started to fade.
Trend strength readings confirm a real trend, and sellers are driving it. Until that balance shifts, any bounce from oversold levels looks more like a pause than a turn.
Why $0.12 Is the Last Shelf Before Open Air
The nearest support on the daily chart sits near $0.12. It is the only mapped floor left under the price.
If ADA closes under that shelf, buyers have no obvious line to defend. Price could slide toward $0.11 before anyone steps in with size.
Resistance tells the other half of the story. The first ceiling sits near $0.18. A close above it would be the first real sign that buyers are returning. The next barrier waits near $0.20, just under the 50-day line.
Even those gains would only repair recent damage. Analysts who track the coin point to the $0.27 high from Oct 5 as the level that matters. That threshold sits nearly double the current price, so a real recovery remains distant.
Two Paths for the Next Three Days
ADA's next move hinges on which side of its narrow range breaks first.
- Bullish: An oversold bounce that reclaims the first ceiling on a daily close would put $0.20 in reach. A slide back below $0.14 would cancel this setup and hand control back to sellers.
- Bearish: A close under the last shelf would open a move toward $0.11. A recovery above the first ceiling would invalidate this view.
Sellers Hold the Wheel Until $0.18 Breaks
The trend still favors sellers. With both averages overhead and momentum pointing lower, the likelier path runs down to the last mapped shelf, and possibly through it.
Late shorts face real risk, though. Deeply oversold coins can snap higher without warning. A sharp squeeze could punish anyone selling into the hole, at least until that first ceiling gives way.
Disclaimer: This article is provided for informational purposes only. It is not offered or intended to be used as legal, tax, investment, financial, or other advice.
Disclaimer: This article is provided for informational purposes only. It is not offered or intended to be used as legal, tax, investment, financial, or other advice.
Related Stories