13,597 BTC Leave MARA's Treasury as the Miner Swaps Bitcoin for AI Data Centers
 Alex Carter

Three Things to Know
- MARA sold a large share of its bitcoin treasury in about six weeks and says more sales are coming.
- Bitcoin trades below both its 50-day and 200-day averages, with sellers still steering momentum.
- The 200-day line near $76,000 now stands as the first test for any rebound.
MARA Holdings, one of the largest public bitcoin miners, has turned into a steady seller of its own coins. The company is raising cash to pay down debt and build AI data centers, and it plans to keep going.
That shift lands at an awkward time for bitcoin. The price sits near a two-month low, and buyers have shown little appetite. Traders now want to know whether the market can absorb a miner that keeps selling.
MARA Sells 40% of Its Bitcoin Stack to Fund an AI Pivot
MARA Holdings sold 13,597 BTC in the roughly six weeks after September, raising about $1.1 billion. The average price came to about $81,039 per coin. The sale equals about 40% of the 34,012 BTC the miner held at the end of September. It also equals six times what MARA mined in the third quarter.
Most of the cash went to debt. MARA said it used $750 million to repay bitcoin-backed loans, which released 17,477 pledged coins. The share of its bitcoin pledged or lent out fell to under 5% from 57%. The company took those loans in August to help buy Long Ridge, a 485 MW natural-gas power business set to close in the coming weeks.
The selling will continue. "We intend to continue using bitcoin to build cash for purposes such as AI infrastructure opportunities," MARA said. Proceeds may also cover debt and buybacks, with up to $500 million authorized by the board.
That reverses the miner's July 2024 pledge to hold every coin it mined. Its 2026 sales now top 40,000 BTC. Third-quarter revenue fell 35% to $164 million. The quarter's $632 million profit leaned on a large accounting gain.
Bitcoin Slips Under Both Key Averages as Miner Supply Hits the Market
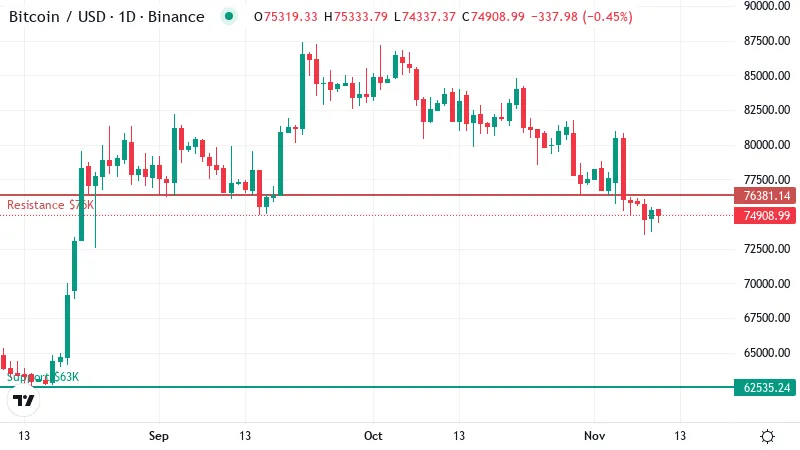
Bitcoin traded near $75,000 on Tuesday, flat over the past day. That leaves the price below its 50-day moving average near $79,000. A moving average smooths out daily swings to show the underlying trend. Price sitting under it means the average now acts as a ceiling.
The 200-day average sits just overhead, near $76,000. That line tracks the longer trend, and bitcoin has slipped beneath it too. With price under both averages, the setup leans bearish on short and long time frames.
MARA did much of its selling above current levels. Its average sale price sat several thousand dollars higher than where bitcoin trades now. The miner sold steadily as the market fell, and buyers absorbed that supply at ever lower prices.
The broader slide is plain. Bitcoin is down about 10% over 30 days. The past week added a further loss of about 2%.
Sellers pushed the price as low as $73,650 on Nov 9, its weakest level in two months. Bitcoin has bounced only modestly since then. The recovery has not yet reached either moving average.
That leaves a thin cushion for fresh supply. A miner that plans to keep selling adds weight to a market already struggling to find buyers. Any rebound now has to work through MARA's ongoing sales first.
Sellers Keep the Upper Hand, Though Not Yet Oversold
Momentum gauges tell the same story as the averages. The daily RSI, a 0 to 100 gauge of momentum, stands near 37. That reading sits in weak territory, below the neutral middle of the scale. It also sits well above 30, the line that marks oversold conditions.
That gap matters for traders hoping for a quick bounce. Oversold readings often attract bargain hunters, but bitcoin has not reached that point yet. The price has room to fall further before the indicator flags a selling extreme.
MACD, a tool that compares short and longer price trends, remains below its signal line. In plain terms, downside momentum has not faded. Trend readings also show sellers in the lead.
Why $76K Is the First Wall Bulls Must Climb
Bitcoin's nearest resistance lines up with the 200-day average. That overlap makes the level harder to break, since sellers who bought near the longer trend line may look to exit there. A daily close back above it would ease the pressure and show buyers regaining some control.
The next hurdle sits near $80,000, close to the 50-day line. Bulls would need to clear both levels to repair the damage of the past month. Until then, rallies are likely to meet steady selling, including from MARA.
Below the market, buyers look scarce. The nearest support sits near $63,000, far below the current price. The data shows no firmer floor between here and there.
That gap creates an air pocket. If the Nov 9 low gives way, the price could slide quickly with few levels to slow it. A break below that support would signal a deeper correction.
Two Paths for Bitcoin Over the Next Three Days
Each setup hinges on a level already in play.
- Bullish: A daily close above the 200-day average would open a run toward the 50-day line. A drop back below the Nov 9 low would cancel this view.
- Bearish: A break under that Nov 9 low would expose the distant support level. A reclaim of the 200-day average would cancel this view.
A Miner Turned Seller Keeps Bitcoin on the Defensive
The bias stays bearish until bitcoin reclaims its 200-day average.
MARA's plan adds a known source of supply to a fragile market. If other miners follow its lead to fund AI projects or pay down debt, extra coins could speed up any break lower. Buyers would then face a heavier load at every level.
Disclaimer: This article is provided for informational purposes only. It is not offered or intended to be used as legal, tax, investment, financial, or other advice.
Disclaimer: This article is provided for informational purposes only. It is not offered or intended to be used as legal, tax, investment, financial, or other advice.
Related Stories