Weakest October in Six Years: Is Bitcoin Bottoming or Setting a Bull Trap?
 Alex Carter

Three Things to Know
-
Bitwise raised its long-term bitcoin target to $1.6 million by 2036 in a new institutional report.
-
Bitcoin sits just under its 50-day average while momentum still leans toward sellers.
-
The 200-day average near $76K is the floor that decides whether a bottom forms.
Bitwise Asset Management published a bullish decade-long forecast for bitcoin on Oct 28, calling it the likely top institutional asset of the next ten years. The report arrived as the coin limped through its weakest October in six years.
The timing sharpens a near-term dilemma for traders. Long-term conviction is rising while the daily chart stays soft ahead of a Fed decision. Traders now want to know whether this quiet slide marks a bottom or sets up a bull trap.
Bitwise Bets on $1.6 Million While October Bleeds
Bitwise Asset Management raised its long-term bitcoin price target. The call sits in the firm's new report, "2027 Bitcoin Long-Term Capital Market Assumptions."
Chief investment officer Matt Hougan and head of research Ryan Rasmussen wrote it with Josh Carlisle and Juan Leon.
The San Francisco firm manages more than $14 billion in client assets across 70+ products. Its model projects a compound annual return of about 34.3%. It also forecasts average volatility near 27.8%. It sees a 0.43 correlation to U.S. stocks. In plain terms, bitcoin would still swing hard but move only loosely with equities.
Bitwise suggests institutions hold 1% to 5% of portfolios in bitcoin. The firm expects it to be the best-performing major institutional asset of the next decade. It also warns of sharp drawdowns, though it sees them shrinking over time. The biggest threats it lists are quantum computing, AI-driven math advances and a regulatory reversal.
Bitcoin traded near $81,360 at 7 a.m. ET on Oct 28.
Bitcoin Sits Right on Its 50-Day Line With the 200-Day Far Below
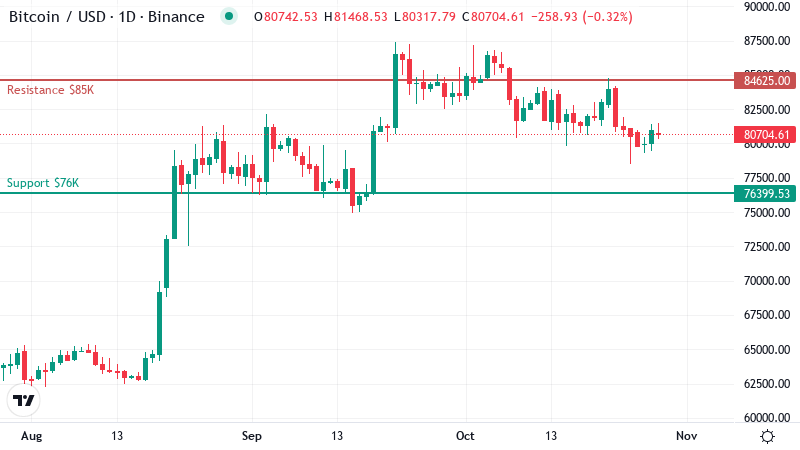
Bitcoin (BTC) daily price with the nearest support (green) and resistance (red). Source: TradingView
Bitcoin was flat over the past 24 hours, sitting right on its 50-day moving average around $81K. A moving average smooths out daily noise by tracking the mean closing price over a set period.
Price has slipped just under that line. A coin below its 50-day average often finds the level acting as a ceiling on rebounds. Buyers would need a clean daily close above it to flip that line back into a floor.
The longer view looks healthier. The 200-day average sits well below the current price. That gap means the broader uptrend from earlier in the year is still intact. Traders watch the 200-day as the dividing line between a bull and a bear market, and bitcoin remains on the right side of it.
Recent losses have been modest. Bitcoin is down about 3% over the past week and roughly 4% over the past month. Those numbers point to a slow grind lower, without the sharp liquidation candles that mark a crash. Sellers have chipped away at price day by day, and buyers have not stepped in with force.
On the daily chart, price drifts between its nearest support and resistance lines with no clear push either way.
Sellers Still Hold a Slight Edge
The daily RSI reads 45. RSI, a 0 to 100 gauge of momentum, compares recent gains with recent losses. A reading just under the midpoint sits in neutral territory, leaning slightly toward sellers.
That matters for anyone hunting a bottom. Market lows often come with RSI dropping below 30, a sign that sellers have exhausted themselves. Bitcoin has seen no such washout yet. The selling has been steady and quiet, which leaves room for more downside before a true flush.
Momentum still points down. The MACD, a tool that tracks shifts in trend speed, remains below its signal line. Until it crosses back above, rallies face a headwind.
Trend strength is also weak. Bitcoin lacks a clear direction, so price tends to chop sideways inside a range. Buyers who chase a one-day pop risk walking into a bull trap.
Where a Bottom Would Be Confirmed or Broken
First support lines up with the 200-day average, and that overlap makes it the key floor. Two signals meeting at one level tend to draw buyers. A bounce there would be the first real sign of a bottom forming.
Closing a day below that floor would change the picture fast. The next support sits near $65K, a deep gap with little in between. Losing the 200-day would also break the longer uptrend, so selling could speed up through that empty stretch.
Upside levels matter just as much. Resistance stands near $85K, and a clean break above it would undercut the bull-trap view. It would show buyers can push past the 50-day ceiling and hold gains.
The room above stays tight, with the next resistance near $87K. Bulls would need to clear both levels before calling the October slide over.
Two Paths Around the Fed Decision
The Fed decision could break bitcoin out of its narrow range in either direction.
-
Bullish: A close above first resistance would open a run toward the next ceiling a short way higher. A slide back under the 50-day average would cancel that setup and revive the bull-trap risk.
-
Bearish: A close below the 200-day floor would point toward the deeper support level. A recovery back above the 50-day line would cancel that view and show buyers still defending the range.
Patience Beats Prediction Here
Bitcoin has not confirmed a bottom yet. That call needs a close back above first resistance. The longer structure still holds while price stays above the 200-day floor. Traders can wait for a close beyond one edge before acting. Bitwise's decade-long thesis gives patient holders that time.
Disclaimer: This article is provided for informational purposes only. It is not offered or intended to be used as legal, tax, investment, financial, or other advice.
Related Stories