Solana Outran Ethereum Over Six Months. Why Is ETH Still the Safer Floor?
 Alex Carter

Three Things to Know
-
A prominent Solana backer says SOL will overtake ETH in market value this cycle, but the network data tells a more mixed story.
-
Both coins have slipped under their 50-day averages while clinging to their long-term trend lines, with sellers still in charge.
-
Solana's key floor sits just under its 200-day average, and a break there opens a much deeper drop than Ether faces.
Multicoin Capital co-founder Kyle Samani is betting that Solana will pass Ethereum in market cap before this cycle ends. He argues Ethereum stays on top mostly because of its stablecoin hoard.
The call lands as both coins lose ground and test their long-term trend lines. Solana has the faster network and the stronger recent run. Ether has the deeper pool of capital. Traders now face a simple question: which floor holds if selling picks up?
A Solana Backer Bets on the Flip While the Numbers Push Back
Samani, an early Solana backer, made the call in a September interview. He argued that almost no one uses Ethereum.
Solana does win on raw performance. It handles more than 1,000 transactions per second, with fees at a fraction of a cent. Ethereum manages 15 to 30 per second, and its average fee runs near $0.15. DefiLlama data puts Solana first in 30-day fee revenue at about $26 million, ahead of third-place Ethereum at $17 million.
Depth tells a different story. Ethereum leads in total value locked with roughly $49 billion. Solana ranks fourth near $6 billion. Ethereum also hosts about $144 billion in stablecoins against Solana's $16 billion. Banks such as JPMorgan Chase are experimenting with stablecoins, and that business sits mostly on Ethereum.
Size is the bigger hurdle. On Oct 24, Ethereum's market cap stood near $288 billion and Solana's near $60 billion. SOL would need to gain roughly 4.8 times relative to ETH to catch up.
Recent trading gives Samani's case some support. Solana rose about 19% over six months while Ethereum added 2%. Over a full year, though, SOL fell about 46% and ETH lost 38%. A flip this cycle still looks unlikely.
Ethereum Slips Under Its 50-Day but Keeps the Long-Term Floor
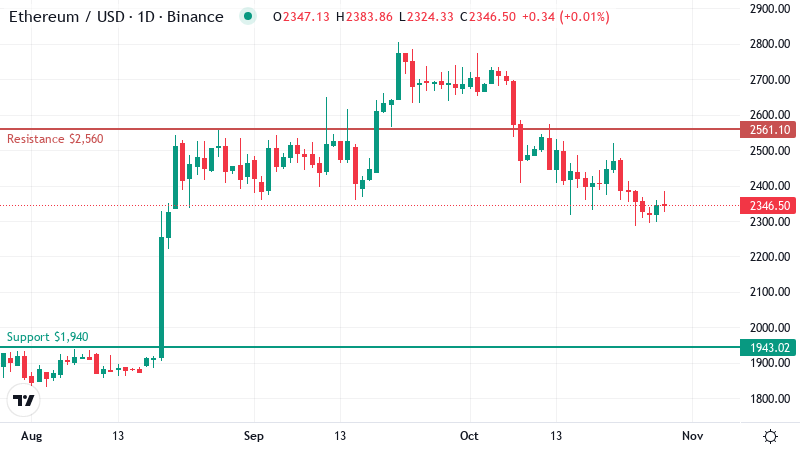
Ethereum (ETH) daily price with the nearest support (green) and resistance (red). Source: TradingView
Ether traded near $2,350 on Thursday, flat over 24 hours. The coin is down about 4% this week and roughly 13% over the past month. That slide has pushed it into a familiar test.
The price now sits below its 50-day moving average near $2,450. A moving average smooths out daily swings to show the trend, and the 50-day tracks the short term. Losing it means the recent uptrend has turned, and that line now acts as a ceiling for any bounce.
ETH still trades just above its 200-day average, which stands near $2,320. That line has acted as a floor so far. The cushion is thin, so a weak session could test it quickly.
Momentum readings lean bearish. RSI, a 0 to 100 gauge of momentum, reads about 38. That means buyers are tired but not yet exhausted, since the oversold zone starts at 30. MACD, a trend-following signal, remains below its signal line, so momentum still points down. Trend-strength readings confirm a real trend, and sellers are leading it.
On the daily chart, the range is clear. Resistance sits near $2,560, above the 50-day line, with the next barrier around $2,650. Bulls would need to clear both averages and that first ceiling to call the pullback over.
Support is further away. The first floor sits near $1,940, and the next one is around $1,850. A break below the 200-day would leave a wide gap down to that zone, with few obvious stops in between.
$97.45 Becomes the Line Solana Bulls Must Hold
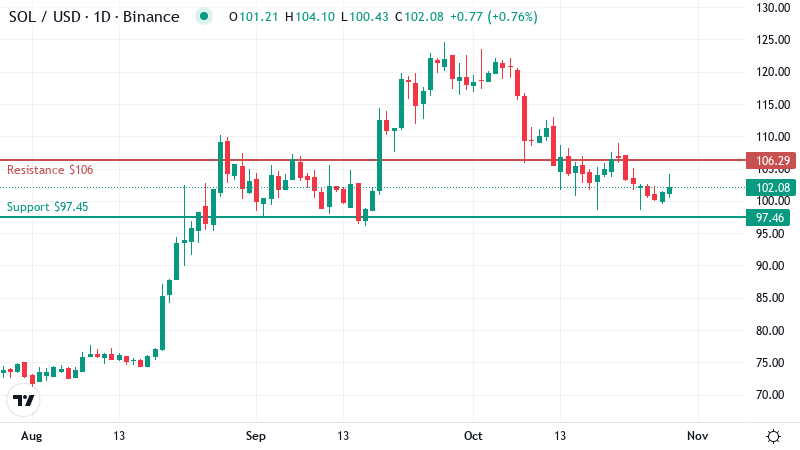
Solana (SOL) daily price with the nearest support (green) and resistance (red). Source: TradingView
Solana changed hands near $102, unchanged on the day. Its weekly loss matches Ether's, but the monthly damage runs deeper, at about 17%. That steeper slide shows sellers have pressed SOL harder than ETH since late September.
The setup looks similar on the surface. SOL sits below its 50-day average near $106, which now caps rebounds. It still holds above its 200-day average around $98, so the broader uptrend remains intact.
RSI reads about 40, a touch firmer than Ether's but still weak. Buyers have room to fade before the oversold zone. MACD stays below its signal line, and trend-strength readings point to a real trend led by sellers.
On the daily chart, first support sits near $97.45, just under the 200-day line. That puts two floors in one narrow band. A daily close below it would mean both have failed at once.
The risk lies below that band. The next support waits near $78, roughly a fifth lower. Ether's gap between floors is far smaller. Overhead, bulls need to reclaim $106 and then $113 to ease the pressure.
What Flips the Pullback Into a Recovery
Both coins need a clear trigger before sellers lose control.
-
Bullish: ETH climbs back above its 50-day average, and SOL closes above its own 50-day ceiling. That would put each coin's second resistance level back in play. A daily close back under either 200-day average would cancel this setup.
-
Bearish: SOL closes below its first support band, and ETH slips under its 200-day line toward its first floor. That would expose Solana's deep gap. A reclaim of both 50-day averages would invalidate this view.
Speed Wins Headlines but Depth Holds the Floor
Samani's flip call rests on speed and fees, and Solana does lead there. Ether still owns the deeper base of locked value and stablecoins. On the charts, ETH looks like the steadier floor. SOL carries more downside if its narrow support band gives way.
Neither coin is safe yet. Sellers lead both trends, so a broad market drop would likely drag them down together.
Disclaimer: This article is provided for informational purposes only. It is not offered or intended to be used as legal, tax, investment, financial, or other advice.
Related Stories