Realized Price vs Market Price: Reading Crypto Cost Basis Onchain
 Sophia Bennett

Realized price is an on-chain estimate of the market’s aggregate cost basis. It takes the realized capitalization of a network and divides it by the circulating supply to produce a per‑coin figure. Market price, by contrast, is the current spot rate quoted by exchanges for immediate settlement.
The two answer different questions. Market price tells you what traders pay right now. Realized price tells you the average price at which the supply last changed hands on-chain. Analysts compare them to gauge unrealized profit and loss, identify cycle regimes, and contextualize holder behavior.
How realized price is calculated
Realized capitalization values each unit of supply at the USD price when it last moved on-chain, rather than today’s spot price. Coin Metrics introduced this cost‑basis lens to distinguish a network’s on‑chain value from its market capitalization, which simply multiplies spot price by supply. See the original concept note from Coin Metrics — Introducing Realized Capitalization.
Realized price converts that aggregate, price‑stamped valuation back into a per‑coin metric using a simple formula: Realized Price = Realized Cap / circulating supply. Data providers publish this series for major assets; for example, Bitcoin’s realized price is charted by Glassnode Studio — Realized Price.
Spot market price is the live rate for immediate purchase or sale, typically the last traded price on an exchange order book. Market capitalization uses that spot price times circulating supply, a different valuation lens than realized price. See Crypto.com — What Is Spot Crypto? for a primer on spot markets.
Realized Cap, Market Cap, and prices: what each measures
These related terms often get conflated. The table clarifies their roles.
| Metric | How it’s built | What it answers |
|---|---|---|
| Market Price (Spot) | Current exchange price for immediate settlement | What buyers and sellers are paying right now |
| Market Capitalization | Spot price × circulating supply | Headline market value at today’s price |
| Realized Capitalization | Sum of all units priced at their last on‑chain move’s USD price | Aggregate on‑chain cost basis of circulating supply |
| Realized Price | Realized Cap ÷ circulating supply | Per‑coin on‑chain cost basis proxy |
Because realized price updates only when coins move on-chain, it is smoother and slower‑moving than spot. Large waves of transactions at new prices pull realized price up or down as supply gets re‑stamped at those levels.
How on‑chain price‑stamping works across chain designs
On UTXO chains such as Bitcoin, each unspent transaction output (UTXO) is “price‑stamped” at the USD rate when it last transacted. Realized capitalization sums the value of all UTXOs at their individual stamps. Account‑based chains apply an analogous approach at the transaction or balance‑movement level, attributing USD prices to units as they move. The common idea across designs is to assign every unit a historical USD timestamp and sum those values to produce realized cap. For a deeper technical discussion, see Glassnode Research — The Foundational On‑chain Metric: The Realized Cap.
These mechanics matter when you interpret realized price. A period with minimal on‑chain spending may leave realized price flat even if spot whipsaws, while heavy re‑pricing activity can move realized price more decisively.

Reading MVRV and holder cohorts with realized price
Comparing market value to realized value produces MVRV: Market Value / Realized Value. This oscillator is widely used to estimate the market’s aggregate unrealized profit or loss and to contextualize cycle extremes. Elevated MVRV suggests a larger share of supply sits above its cost basis, while depressed MVRV implies stress and realized losses among sellers. Analysts also segment investor cohorts by their cost basis, such as short‑term versus long‑term holders, to see which groups are under water. See Glassnode Research — The Foundational On‑chain Metric: The Realized Cap.
Realized price itself offers a simple threshold. When spot trades above realized price, the average unit is, by definition, in unrealized profit. When spot dips below realized price, the average unit sits at an unrealized loss, a regime historically associated with capitulation and forced selling in some cycles.
Worked example: when spot falls below realized price
During the 2021–22 drawdown, Bitcoin’s spot price traded below realized price, a historically uncommon regime. On‑chain analysts used that signal, along with depressed MVRV readings, to describe broad unrealized losses and capitulation during that bear market. See Glassnode Research — A Bear of Historic Proportions (June 24, 2022).
How to read such a setup in practice:
- Check the relationship between spot and realized price. If spot is below realized price, the market’s average unit is at an unrealized loss.
- Consult MVRV for confirmation. Depressed MVRV supports a broad loss regime, while rebounds toward 1.0 can indicate mean‑reversion pressure.
- Look at cohort metrics. If short‑term holders carry most of the pressure while long‑term holders hold, the market may be absorbing losses rather than distributing them.
This framework provides context, not certainty. It helps frame risk and sentiment by anchoring to realized cost levels stamped on-chain.
A practical checklist to apply realized price
Use realized price and its companions as a structured read on market context:
- Level check: Is spot above or below realized price? That’s a quick pulse on average unrealized P/L.
- Cycle gauge: Is MVRV stretched or depressed relative to its history? Extreme readings often coincide with late‑cycle euphoria or deep stress.
- Holder analysis: Which cohorts sit above or below cost? Segmenting by holding time highlights who is likely to supply or absorb liquidity.
- Trend behavior: Is realized price rising or falling? A rising slope implies recent re‑pricing at higher levels, while a falling slope implies re‑pricing lower.
- Cross‑asset comparison: Compare assets on the same footing. Realized price allows apples‑to‑apples context for chains with different tokenomics, so long as their on‑chain movement reflects genuine ownership changes.
Data providers often visualize realized cap against spot price to reveal these dynamics. For an example, see the Glassnode visualization linked in The Foundational On‑chain Metric, which contrasts realized value and spot behavior clearly.
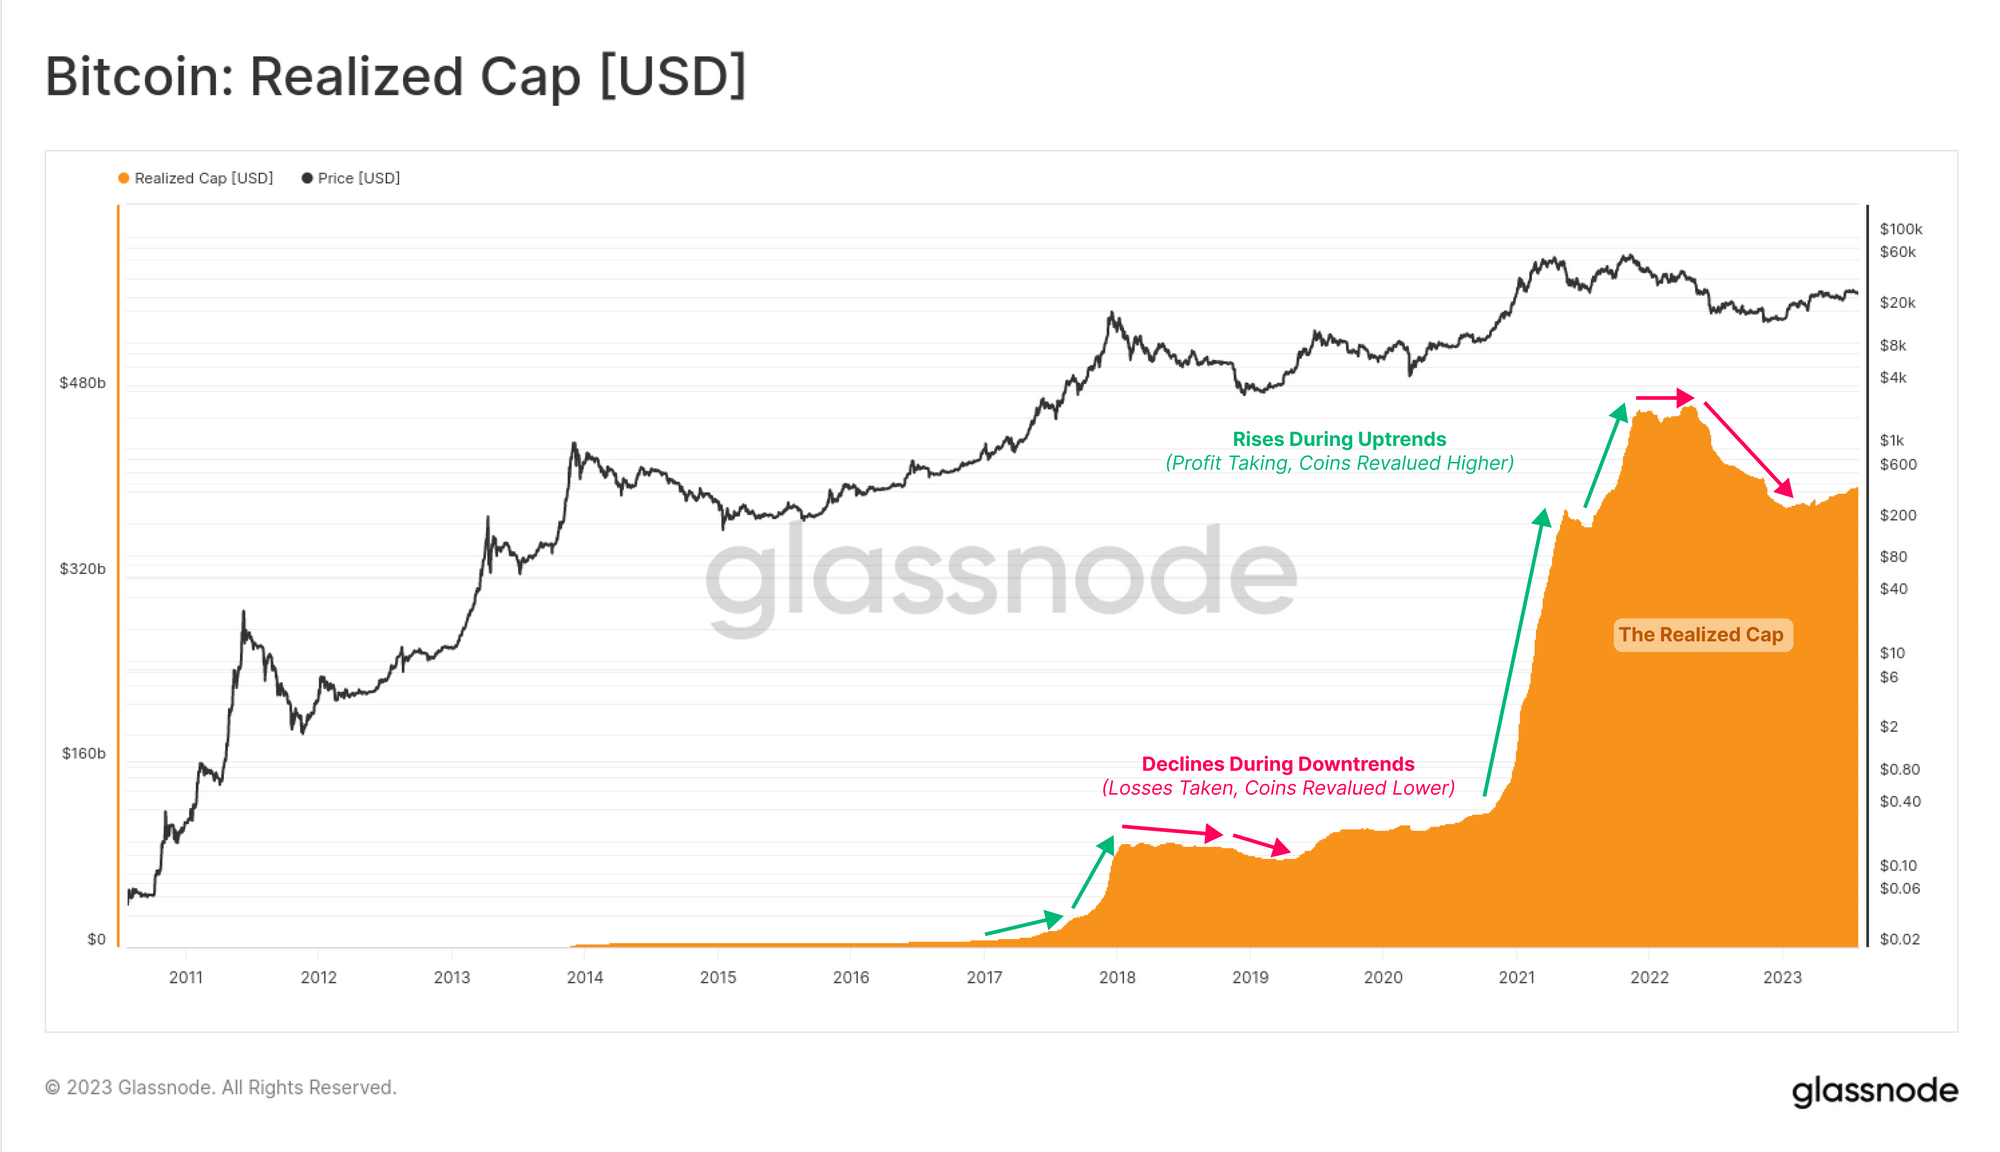
Glassnode visualization: Bitcoin Realized Cap (orange area) vs market price (black line) — a direct on‑chain illustration of how realized value and spot price diverge (useful for reading realized price vs market price and MVRV analysis). — Source: Glassnode Research — The Foundational On‑chain Metric: The Realized Cap
Limits, blind spots, and misconceptions
Realized price is an approximation of aggregate cost basis observed on-chain. It does not see everything and should be interpreted with care:
- Off‑chain activity is invisible. Internal exchange transfers, custodial reshuffles, OTC deals, and fiat conversions do not always reflect true ownership changes on chain. This can cluster cost basis around large custodians and skew attribution. See caveats summarized in Glassnode Research — The Foundational On‑chain Metric.
- Lost or unrecoverable coins persist in the supply count. Their ancient price stamps remain, potentially biasing realized cap and realized price versus the economically active float.
- Forks and protocol events can complicate supply accounting. Data providers handle these differently, which can affect comparability.
- It is not your personal cost basis. For U.S. federal tax purposes, an individual’s basis is the USD amount paid to acquire the asset (including fees), documented with records. The IRS may accept blockchain explorer evidence for specific transactions, but the aggregate realized price of a network is not a taxpayer’s legal basis. See IRS — Frequently Asked Questions on Virtual Currency Transactions.
Treat realized price as a market‑structure lens, not a timing tool. It can frame risk zones and participation, but it does not predict future price paths.
When you’ll use realized price in practice
You will encounter realized price whenever you need an anchor for on‑chain cost basis: evaluating cycle conditions, comparing assets’ stress levels, or assessing whether holders are broadly in profit or loss. It is especially useful when paired with MVRV and cohort metrics to triangulate positioning.
In day‑to‑day analysis, start with the level check versus spot, scan MVRV for strain or froth, and then drill into cohort cost basis to see which groups are likely to supply or demand liquidity. Use this framework to inform risk framing and narrative, not to substitute for a trading plan.
Frequently Asked Questions
Is realized price the average buy price of all holders?
No. Realized price is the per‑coin value implied by realized capitalization, which price‑stamps units when they last moved on-chain. It is an aggregate proxy that excludes off‑chain trades and may reflect custodial clustering, so it is not a precise average of individual purchase prices.
How often does realized price change?
It updates as coins move on-chain and receive new price stamps. In quiet periods with little re‑pricing, realized price can be flat even while spot is volatile. During heavy on‑chain turnover, realized price can move more visibly.
Can I use realized price for tax reporting?
No. Taxpayers must use their documented acquisition cost, including fees, to establish basis and holding periods. Aggregate on‑chain realized price is not accepted as an individual’s legal cost basis. See the IRS virtual currency FAQs.
Does realized price work for Ethereum and other chains?
Yes, with an account‑based attribution method that price‑stamps units when balances move. The principle is the same as UTXO chains, but implementation details differ and can affect precision, especially around exchanges and smart contract activity.
What does MVRV = 1 mean?
When market value equals realized value, MVRV is 1.0 and spot equals the market’s aggregate on‑chain cost basis. It is a common reference level in cycle analysis because it marks a broad break‑even point for the average unit.
Why is realized price smoother than spot price?
Spot reflects every trade in real time. Realized price only changes when coins move on-chain, so it ignores intraday ticks that do not coincide with ownership changes recorded on the ledger.
Disclaimer: This article is provided for informational purposes only. It is not offered or intended to be used as legal, tax, investment, financial, or other advice.
Related Stories