S&P 500 Today: Oil Above $100 Deepens the Tech Selloff
 Andrei Popescu
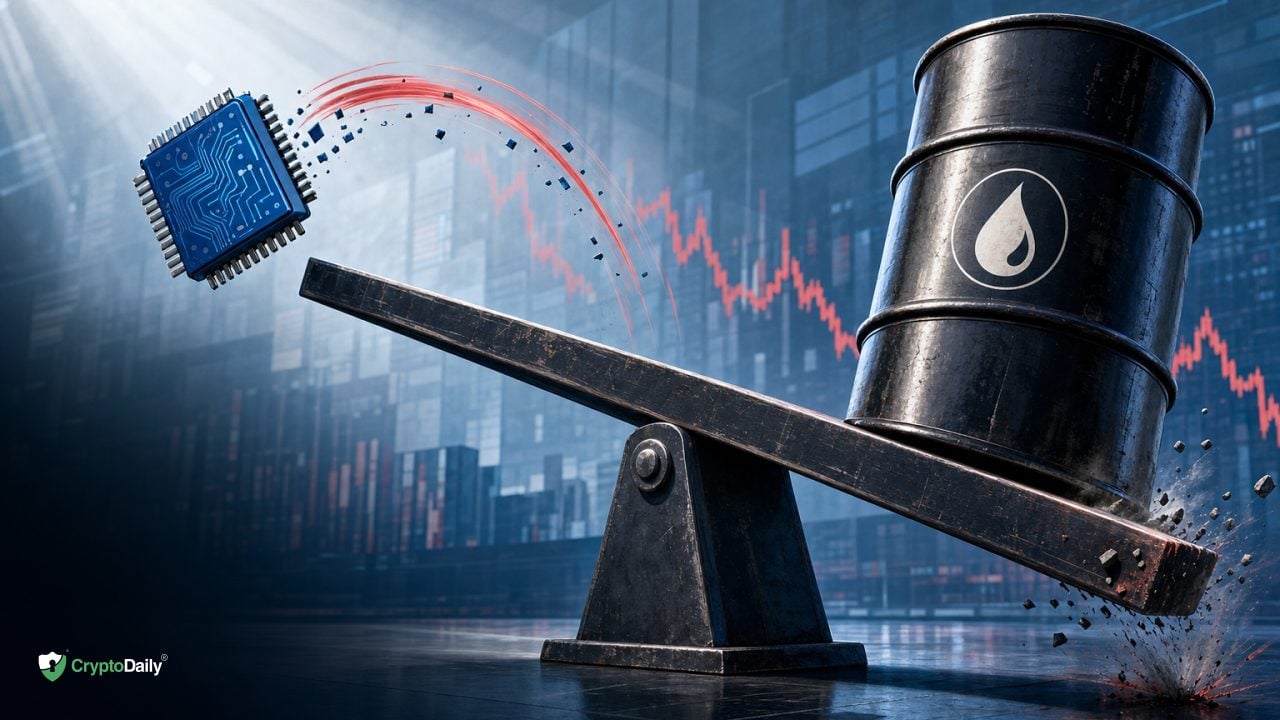
Oil finally cracked triple digits again, and the tape flipped risk-off in a hurry. Brent settled above $100 per barrel after renewed shipping attacks, a headline that tends to land right on the growth end of the market.
By the close, the S&P 500 gave back ground while megacap tech saw the heaviest selling. Traders pinned the move on a mix of higher input costs, stickier inflation risk, and earnings updates that re-opened the conversation about AI spending.
Let’s unpack what actually moved and what matters next, without the noise.
| Point | Details |
|---|---|
| Oil clears $100 | Brent settled near $100.69 after tanker attacks in the Red Sea, a roughly 7% one-day jump AP News. |
| S&P 500 lower | Index closed around 7,408.30, down 1.21% with broad weakness led by megacap tech Los Angeles Times. |
| Tech under pressure | Nasdaq Composite fell about 2.15% as investors questioned AI capex intensity while oil spiked Reuters. |
| Megacaps lead declines | Tesla dropped roughly 14–15% and Alphabet slid about 7% after earnings updates and guidance Reuters. |
| Rotation on the tape | Energy and select defensives saw relative bids while long-duration growth lagged. |
| Macro readthrough | Higher oil can lift headline inflation expectations and firm rate path uncertainty. |
Oil at $100: why this hit differently today
Energy shocks aren’t new. What made this one sting was the speed and the backdrop. Brent settling near $100.69 wasn’t a slow grind. It was a roughly 7% jump in a single session tied to tanker attacks in the Red Sea, which reintroduces supply and shipping risk AP News.
There are three quick channels from oil to equities:
- Inflation optics. Higher crude lifts headline inflation expectations. That alone can nudge yields and tighten financial conditions even before any data hits.
- Corporate margins. Transportation, logistics, and energy-intensive industries see input costs rise fast. Some can pass them on. Many can’t, at least not right away.
- Risk premia. Geopolitical headlines push investors to demand more compensation for risk. Equities, especially high multiple names, feel that first.
Layer that on a market that has been leaning into AI growth stories and you get a sharp rotation. It wasn’t just oil up and tech down. It was oil up, inflation risk up, duration risk up, and then a pile-on in the names with the richest expectations.
Why tech took the brunt
Tech didn’t need much of a shove. Earnings landed into a market already debating how quickly AI revenues will offset the rising cost to build out AI infrastructure. The Nasdaq slid about 2.15% as those worries ran into the oil spike and higher-rate narrative Reuters.
Rates and duration in plain English
Growth stocks behave like long-duration assets. Most of the cash you’re paying for today is expected to arrive years out. When rates rise or inflation fears tick up, those future dollars get discounted more. Same earnings, lower present value. That’s the math, and on a headline day it shows up fast in the highest multiple names.
Capex shock and AI spend
There’s also the simple issue of cash out the door. AI buildouts are capital hungry. Data centers, chips, power. If management teams guide to higher capex or longer payback periods, investors recalibrate. That’s part of why the megacaps led the declines. Tesla fell roughly 14–15% and Alphabet dropped around 7% after their updates and guidance stirred concerns about spending and growth timing Reuters.
Pro tip: On days like this, re-read the guidance language, not just the EPS line. Where the company puts capex and opex for AI tells you more about near-term margins than the headline beat or miss.
Scoreboard and rotation inside the S&P 500
The S&P 500 closed near 7,408.30, down about 1.21%, with the heaviest pain in growth-heavy corners Los Angeles Times. Energy and select defensives held up better. That’s the classic oil-day pattern.
Here’s a quick way to think about it without overfitting to one session:
- Leaders on the day: Energy producers, integrated majors, some refiners, and pockets of utilities that benefit from rate stability or regulated returns.
- Laggards: High multiple software, AI platform names tied to big capex, EVs exposed to consumer demand sensitivity, and ad-driven platforms when macro nerves flare.
- Middle of the pack: Industrials and materials split based on fuel intensity and pricing power. Financials drift with the yield curve and credit tone.
| Likely Headwinds if Oil Stays Elevated | Potential Support if Oil Stays Elevated |
|---|---|
| Airlines; package delivery; rideshare; energy-intensive manufacturing; long-duration growth with rich multiples | Energy producers; oilfield services; pipelines; select utilities; commodity-linked miners |
| EV makers with price-sensitive demand; ad-driven platforms in a risk-off tape | Value-tilted cyclicals with pricing power; defensive consumer staples |
Watch breadth: If oil cools and tech still can’t catch a bid, that signals the issue is earnings quality and AI payback timing more than crude.

What to watch over the next two weeks
1) Energy data and supply lines
- EIA weekly petroleum status and inventory trends. Big draws with tight refined product stocks keep gasoline prices sticky.
- Shipping lanes. Continued Red Sea disruptions can keep freight costs higher and complicate supply chains. That’s the spillover the market hates.
2) Inflation prints and rate path
- Next CPI and PCE reports. Headline could re-accelerate if pump prices move. Core is what the Fed watches, but headline shapes sentiment.
- Fed communications. Even a steady policy stance can feel tighter if real rates drift up on growth and inflation mix.
3) Earnings and guidance language
- Capex cadence. Look for phasing language on AI infrastructure. Front-loaded or staged over multiple years makes a big difference to margins.
- Pricing power. Which companies can pass along fuel and freight costs without losing volume.
- Demand elasticity. EVs and discretionary tech tend to show it quickly when macro turns choppy.
4) Positioning and liquidity
- Dealer gamma and options expiries. Into low-liquidity periods, hedging can amplify moves.
- Trend signals. If 20 and 50 day moving averages start breaking across megacaps, passive outflows can follow.
Practical steps for a choppy tape
Different investors, different playbooks. A few principles travel well when oil shocks hit growth at the same time earnings are in flux.
- Recheck concentration. If a couple of megacaps drive your portfolio risk, set guardrails. Position sizing usually beats hero trades on headline days.
- Stress test margins. For your holdings, map what 5 to 10% higher energy and freight does to gross margin and unit economics. If you can’t answer that, you’re flying blind.
- Hedge selectively. Index puts or collars around catalysts can be cheaper than panic selling. Manage cost and duration. Know your exit.
- Avoid chasing energy spikes. Energy can work, but entries after big one-day moves often mean poor risk-reward. Scale, don’t lunge.
- Mind the cash buffer. Volatility clusters. Having dry powder helps you nibble when spreads widen and good names get tossed out with the bad.
Pro tip: Separate your time horizons. What you do tactically for the next two weeks should not rewrite a five-year plan. Use separate checklists for each.
Crypto angle: when equities sneeze
It’s a stock market story, but crypto doesn’t live in a vacuum. On days when yields tick up and growth stocks get hit, Bitcoin and Ethereum often see sympathy moves. Not every time, and not by the same magnitude, but enough to matter for risk management.
- Correlation watch. In risk-off sessions with higher yields, correlations across risk assets can compress. That can dull crypto’s diversification benefit over short windows.
- Energy sensitivity. Miners face power cost dynamics when energy spikes. Profitability swings can feed into supply behavior at the margin.
- Stablecoin liquidity. If equities wobble around quarter-end or large catalysts, watch stablecoin supply and on-chain volumes as a barometer for crypto risk appetite.
For multi-asset traders, the message is simple. One macro shock can ripple through several books. Keep an eye on cross-market stress signals and avoid stacking the same bet in different wrappers.

Daily S&P 500 closing levels (June 24–July 24, 2026) — highlights the decline on July 23 that coincided with Brent crude topping $100, useful to visualize the market impact of the oil spike. — Source: Federal Reserve Bank of St. Louis (FRED)
Common mistakes on a $100 oil day
- Reading a one-day move as destiny. Oil can retrace, earnings narratives can evolve, and positioning can swing the other way just as fast.
- Ignoring base rates. Tech drawdowns during earnings season are common. Context matters more than the size of a single candle.
- Doubling down on leverage. Vol spikes and gap opens crush tight stops and thin margins. Risk first, views second.
- Skipping the call. The presentation deck won’t capture how a CFO frames capex and returns. Tone matters.
- Forgetting tax and time horizons. Short-term trades have real costs. Don’t morph an investment account into a day-trading account overnight.
Hard rule: if you don’t know where you’re wrong, you don’t have a trade. This is not financial advice, just basic survival in volatile markets.
Three near-term paths from here
1) Oil holds above $100 and tech stabilizes
If crude stays near triple digits but supply fears ease, markets could settle into a new range. Tech might base if earnings language gets clearer on AI payback and capex phasing. Expect chop, not trend.
2) Oil retraces and risk rallies
Headlines calm, shipping normalizes, inventories rebuild. A quick pullback in crude would relieve inflation optics and duration pressure. The strongest balance sheets in tech usually catch the first bids.
3) Escalation and tighter financial conditions
Further disruptions push oil higher and widen risk premia. That scenario tends to support energy and defensives while compressing multiples elsewhere. Credit spreads would be the tell.
Pro tip: Watch the front of the curve. If 2-year yields rise alongside oil and growth stumbles, the market is pricing tighter policy risk. If 2-year yields ignore oil, it’s viewing the spike as transitory.
If you want a clean morning brief that sticks to the key moves and what they mean for risk, Crypto Daily’s quick reads keep you ahead of the next open. Check the latest wraps at Crypto Daily.
Frequently Asked Questions
Why does $100 oil hit tech stocks so hard?
Two reasons. Higher oil lifts headline inflation expectations, which can nudge yields up and hurt long-duration assets like growth stocks. And it arrives alongside big AI investment cycles. When investors see higher input costs and heavier capex at the same time, they compress multiples in the most expensive corners first.
Is this the start of a longer tech downturn?
One day doesn’t set a trend. The key is whether earnings calls calm fears about AI spend and margins. If guidance firms up and oil cools, tech can stabilize. If high capex and slower payback persist while oil stays elevated, pressure could linger.
Which sectors benefit if oil remains above $100?
Energy producers, oilfield services, and pipelines usually see support. Certain defensives like regulated utilities and staples can outperform on a relative basis when risk premia rise. Results vary case by case, so balance sheet quality and pricing power matter more than labels.
How did the broader market close today?
The S&P 500 ended around 7,408.30, down roughly 1.21%, while the tech-heavy Nasdaq Composite slipped about 2.15%. Megacaps like Tesla and Alphabet led the declines after earnings and guidance stirred spending worries.
Does oil over $100 mean inflation will jump right away?
Not instantly. It depends on how long prices stay elevated and how quickly higher fuel and freight costs feed through to goods and services. Headline inflation optics move fast. Actual pass-through to core measures takes time and differs by sector.
What should long-term investors do on days like this?
Revisit allocation and risk limits, not your entire thesis. Check concentration, revisit margin sensitivity, and avoid knee-jerk moves. If your plan assumed volatility, stick to it. If it didn’t, build a better one when markets are closed, not mid-selloff.
Where can I follow these cross-market moves daily?
Look for concise morning and closing notes that track oil, yields, earnings, and sector moves together. Crypto Daily publishes quick wraps that connect equities, macro, and digital assets without the fluff.
Disclaimer: This article is provided for informational purposes only. It is not offered or intended to be used as legal, tax, investment, financial, or other advice.
Related Stories