Bitcoin Price Analysis: Bids Around 27158 - 25 April 2023
BTC/USD Bids Mount Around 27158: Sally Ho’s Technical Analysis – 25 April 2023
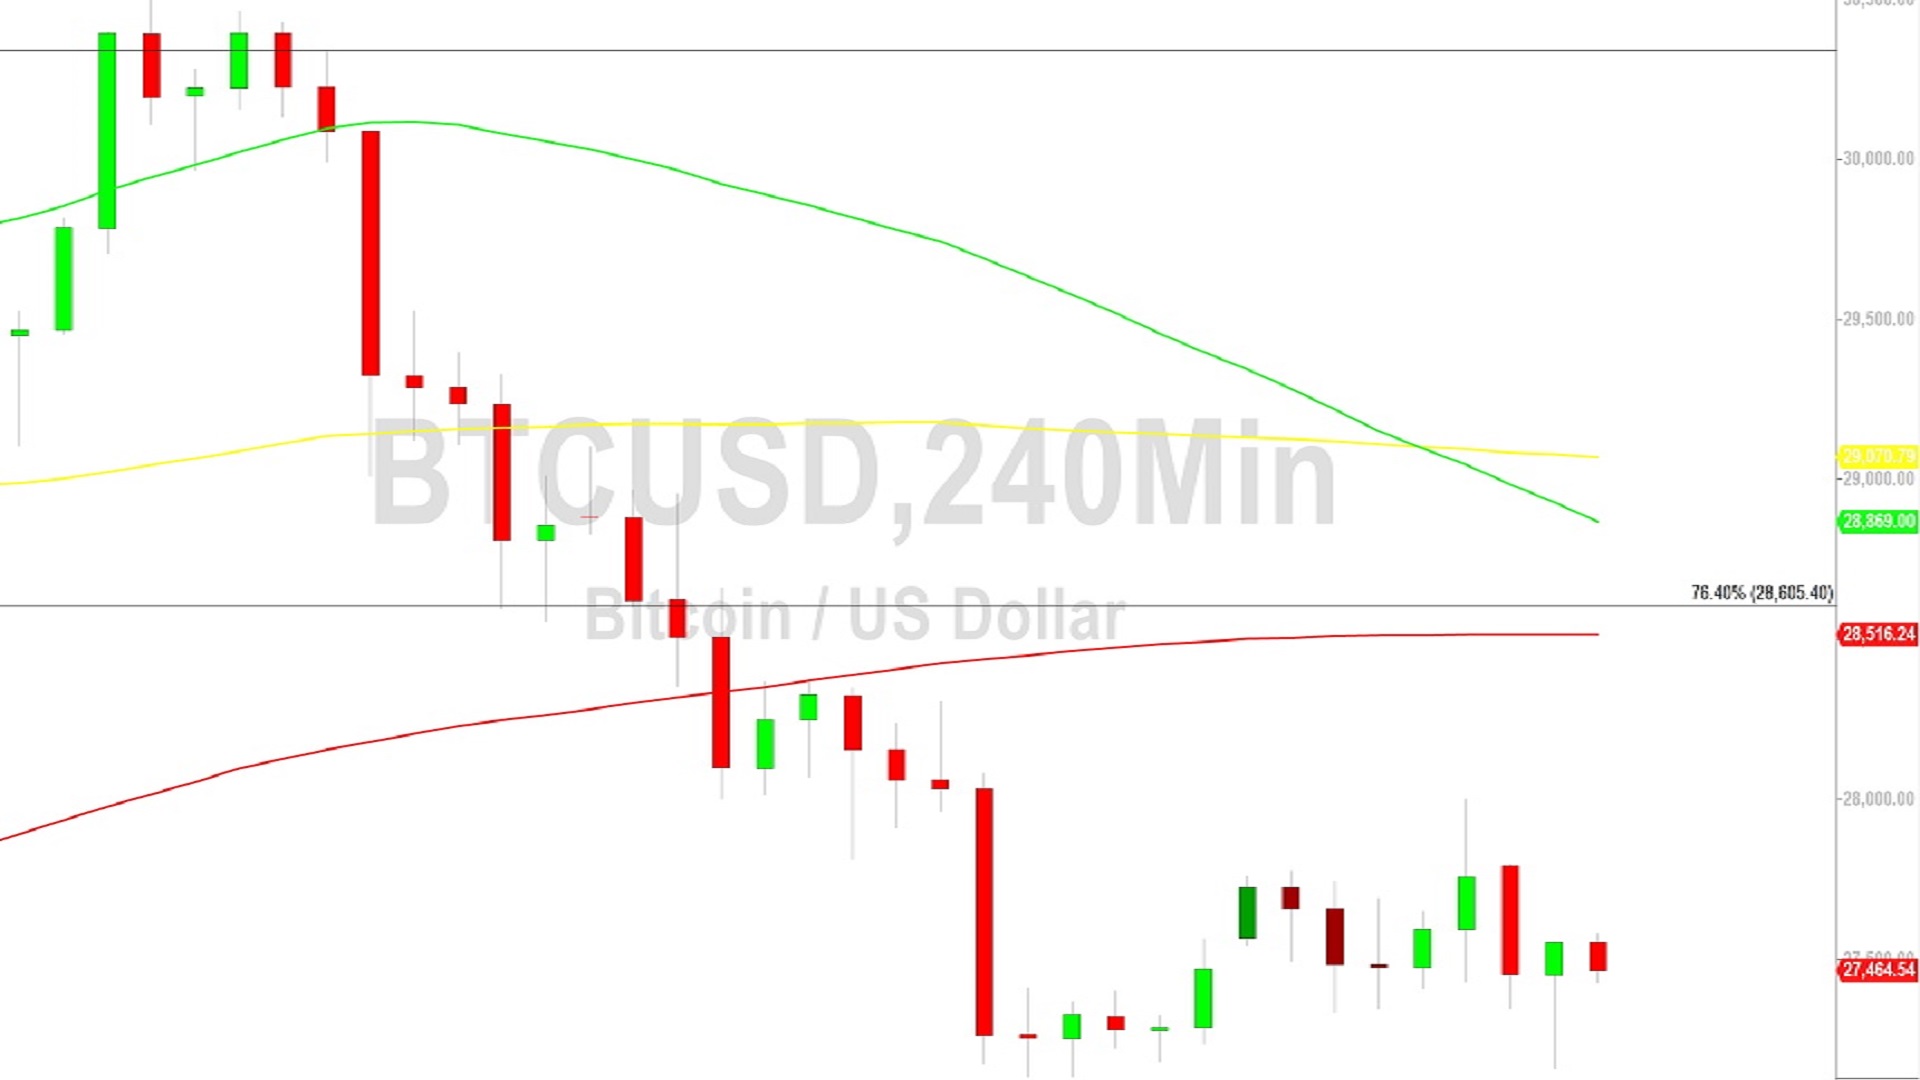
Bitcoin (BTC/USD) remained pressured early in the Asian session as the pair orbited the 27500 area after failing to advance above the 28034.13 level, a downside price objective linked to selling pressure that emerged around the 29102.69 level. Some buying pressure emerged around the 27158.67 area when traders tested recent lows below the 27283.59 area, another downside price objective. Traders are eyeing the recent depreciating range from 29526.98 to 27133 where some retracement levels include the 28047, 28329, 28612, 28962, and 29014 levels. Downside price objectives related to recent depreciating ranges and levels include the 27119, 26533, 26085, 25604, and 24103 levels. Following recent price activity, retracement levels and areas of potential technical resistance include the 29159, 29383, 29408, 29657, 29701, 29965, 30012, 30413, and 30472 levels.
Following recent price activity, retracement levels and areas of potential technical support include the 26664, 25309, 25094, 23954, 23255, and 21415 levels. Upside price objectives include the 31477.37, 32501.23, 32989.19, 34583.96, 34658.69, 35222.66, 37765.28, and 38403.97 levels. Another important price objective is the 31846.88 area, a level that represents the 50% retracement of the depreciating range from 48233.76 to 15460. Traders are observing that the 50-bar MA (4-hourly) is bearishly indicating below the 100-bar MA (4-hourly) and above the 200-bar MA (4-hourly). Also, the 50-bar MA (hourly) is bearishly indicating below the 100-bar MA (hourly) and above the 200-bar MA (hourly).
Price activity is nearest the 200-bar MA (4-hourly) at 28516.23 and the 50-bar MA (Hourly) at 27484.71.
Technical Support is expected around 27119.16/ 26533.04/ 25604.51 with Stops expected below.
Technical Resistance is expected around 31986.16/ 32989.19/ 34658.69 with Stops expected above.
On 4-Hourly chart, SlowK is Bearishly below SlowD while MACD is Bullishly above MACDAverage.
On 60-minute chart, SlowK is Bullishly above SlowD while MACD is Bullishly below MACDAverage.
Disclaimer: Sally Ho’s Technical Analysis is provided by a third party, and for informational purposes only. It does not reflect the views of Crypto Daily, nor is it intended to be used as legal, tax, investment, or financial advice.

Related Stories