Bitcoin Price Analysis: Weaker to 21851 - 9 March 2023
BTC/USD Weakens to 21851: Sally Ho’s Technical Analysis – 9 March 2023
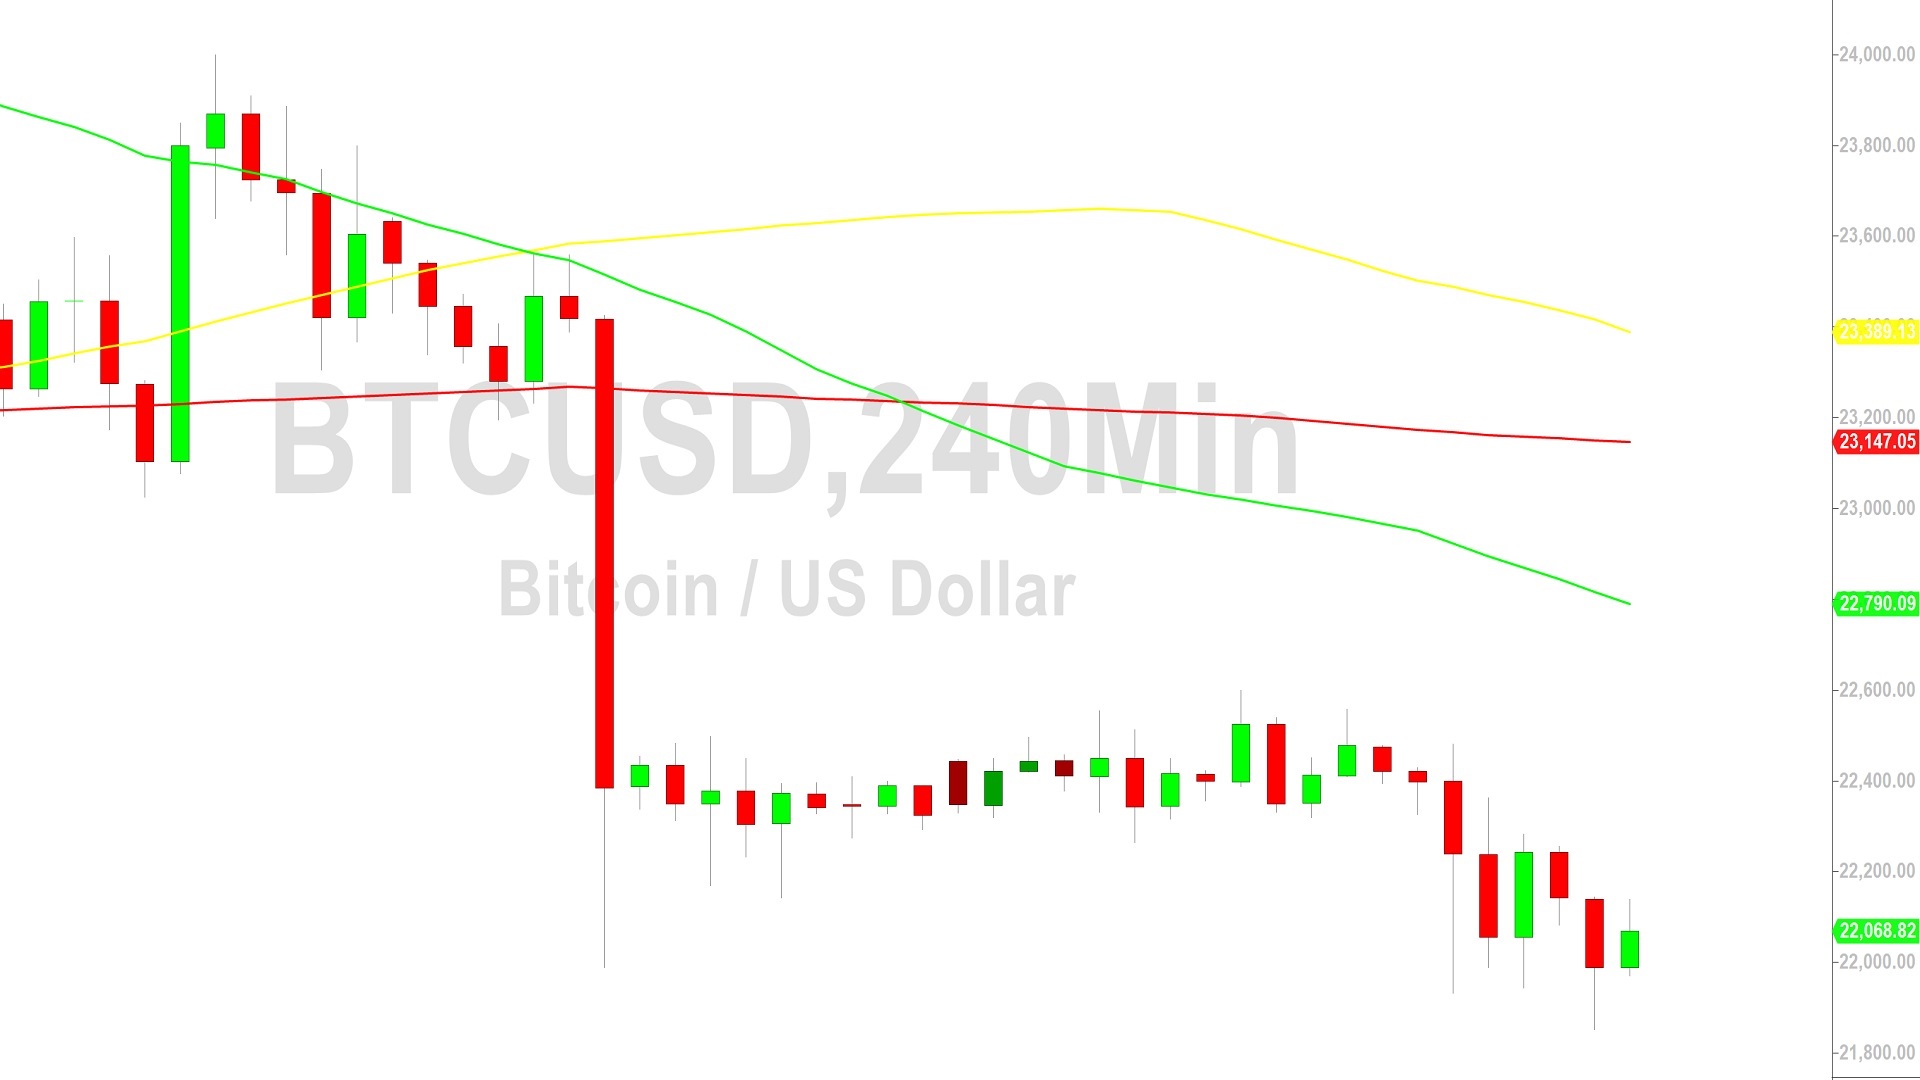
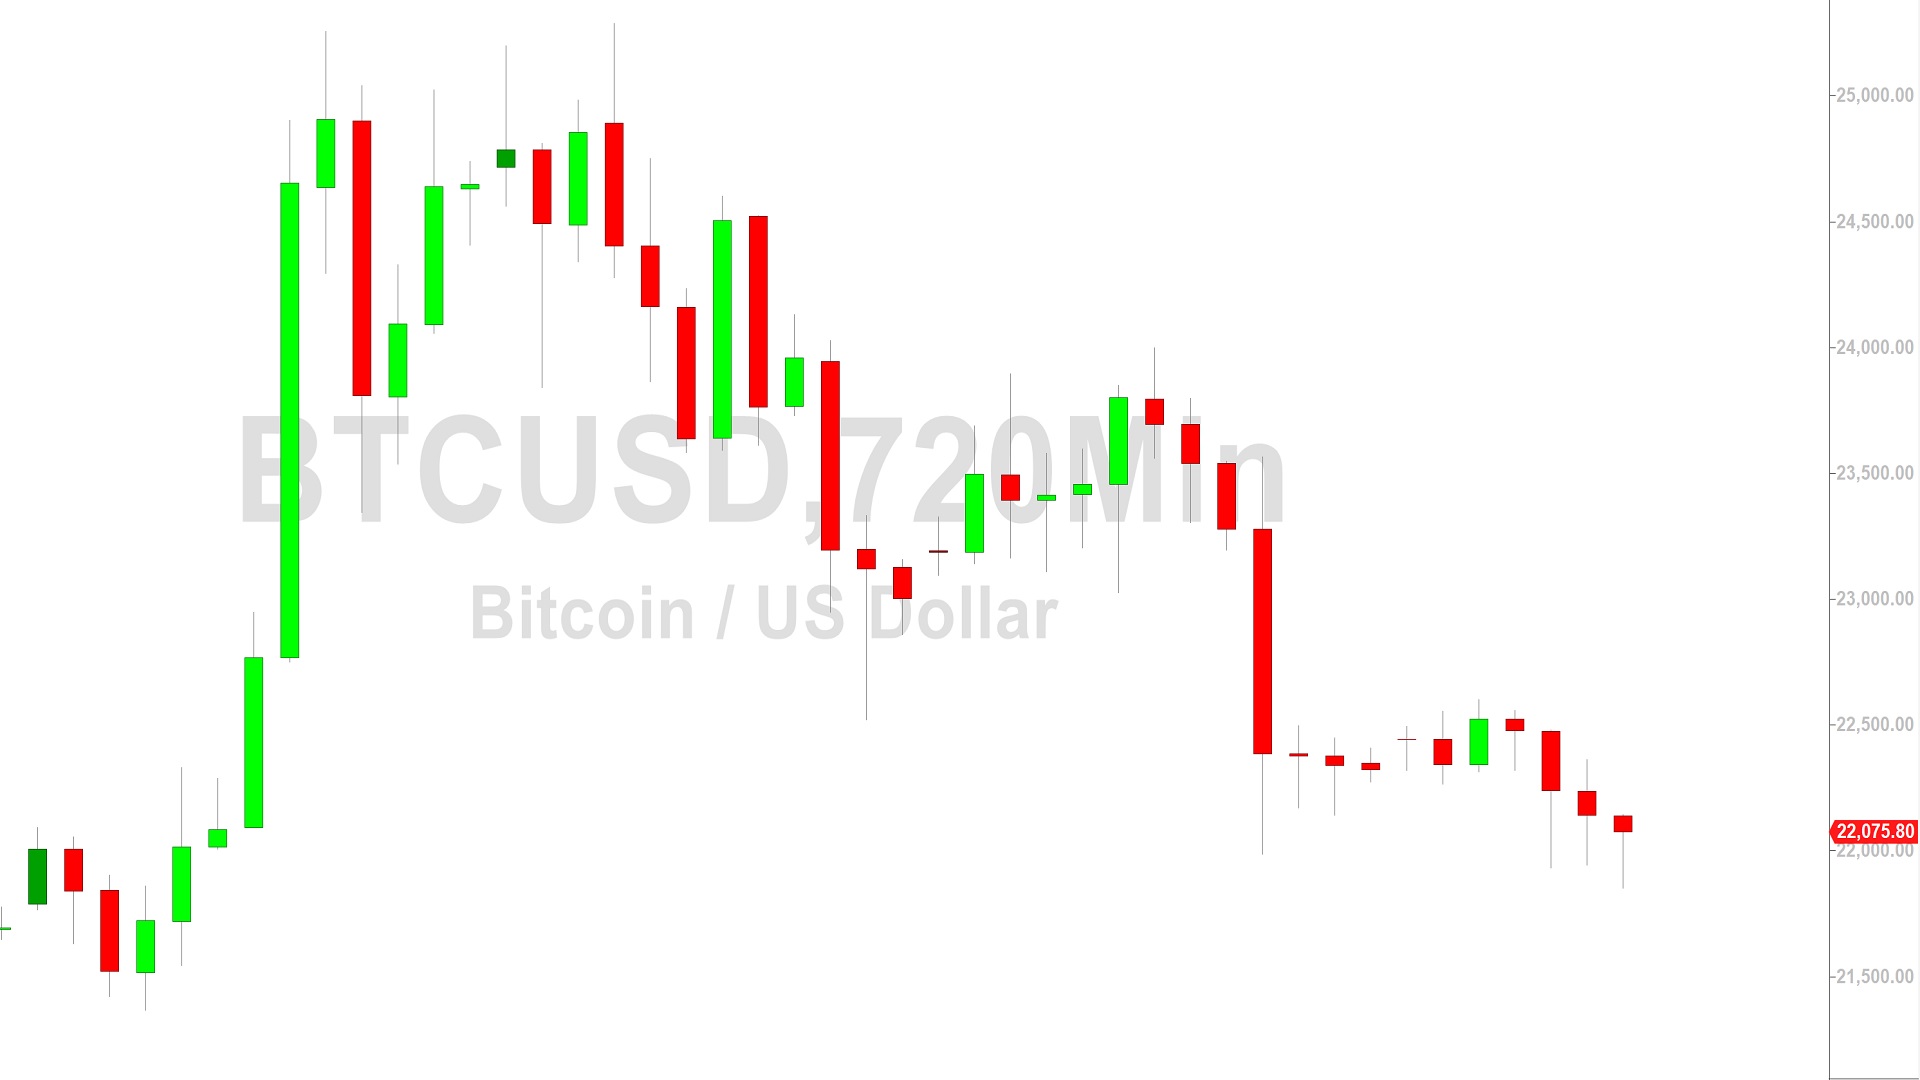
Bitcoin (BTC/USD) continued to suffer from bearish momentum early in the Asian session as the pair depreciated to the 21851.77 level after Stops were elected below the 21919 area, a downside price objective associated with selling pressure around the 24262 and 23451 levels in early February. Additional downside price objectives linked to these levels include the 21366 and 20471 levels. Acute selling pressure recently knocked BTC/USD below some major downside price objectives around the 22988, 22943, 22832, 22770, 22587, 22277, 22210, and 22074 levels. Stops were elected below the 22292 and 22205 levels during the ongoing pullback, retracement levels related to an appreciating range that commenced with buying pressure around the 21366 levels. Additional downside price objectives include the 21756, 21566, 21386, 21161, 20982, 20687, 20471, 20209, 19886, 19266, 19251, 19132, and 17230 levels.
The recent multi-month high around 25288.88 represented a test of the 25455 level, an upside price objective related to historical buying pressure around the 16326.16 and 20333.33 areas. Additional upside price objectives include the 25455, 25774, 26612, 26931, 27609, 28004, 29244, and 29639 levels. Stops are cited below the 21047, 20874, 20724, and 20370 levels. Below current price activity, technically significant areas include the 15900, 15512, 15313, 14500, 14364, 13369, 10727, 10432, 9682, 8837, and 7538 levels. Traders are observing that the 50-bar MA (4-hourly) is bearishly indicating below the 100-bar MA (4-hourly) and below the 200-bar MA (4-hourly). Also, the 50-bar MA (hourly) is bearishly indicating below the 100-bar MA (hourly) and below the 200-bar MA (hourly).
Price activity is nearest the 50-bar MA (4-hourly) at 22790.23 and the 50-bar MA (Hourly) at 22299.47.
Technical Support is expected around 18390.99/ 16714.46/ 14500.15 with Stops expected below.
Technical Resistance is expected around 25455.06/ 25774.41/ 26612.64 with Stops expected above.
On 4-Hourly chart, SlowK is Bearishly below SlowD while MACD is Bearishly below MACDAverage.
On 60-minute chart, SlowK is Bullishly above SlowD while MACD is Bullishly above MACDAverage.
Disclaimer: Sally Ho’s Technical Analysis is provided by a third party, and for informational purposes only. It does not reflect the views of Crypto Daily, nor is it intended to be used as legal, tax, investment, or financial advice.

Related Stories