Bitcoin Price Analysis: Breather Around 22074 - 14 March 2023
BTC/USD Takes Breather Around 22074: Sally Ho’s Technical Analysis – 14 March 2023
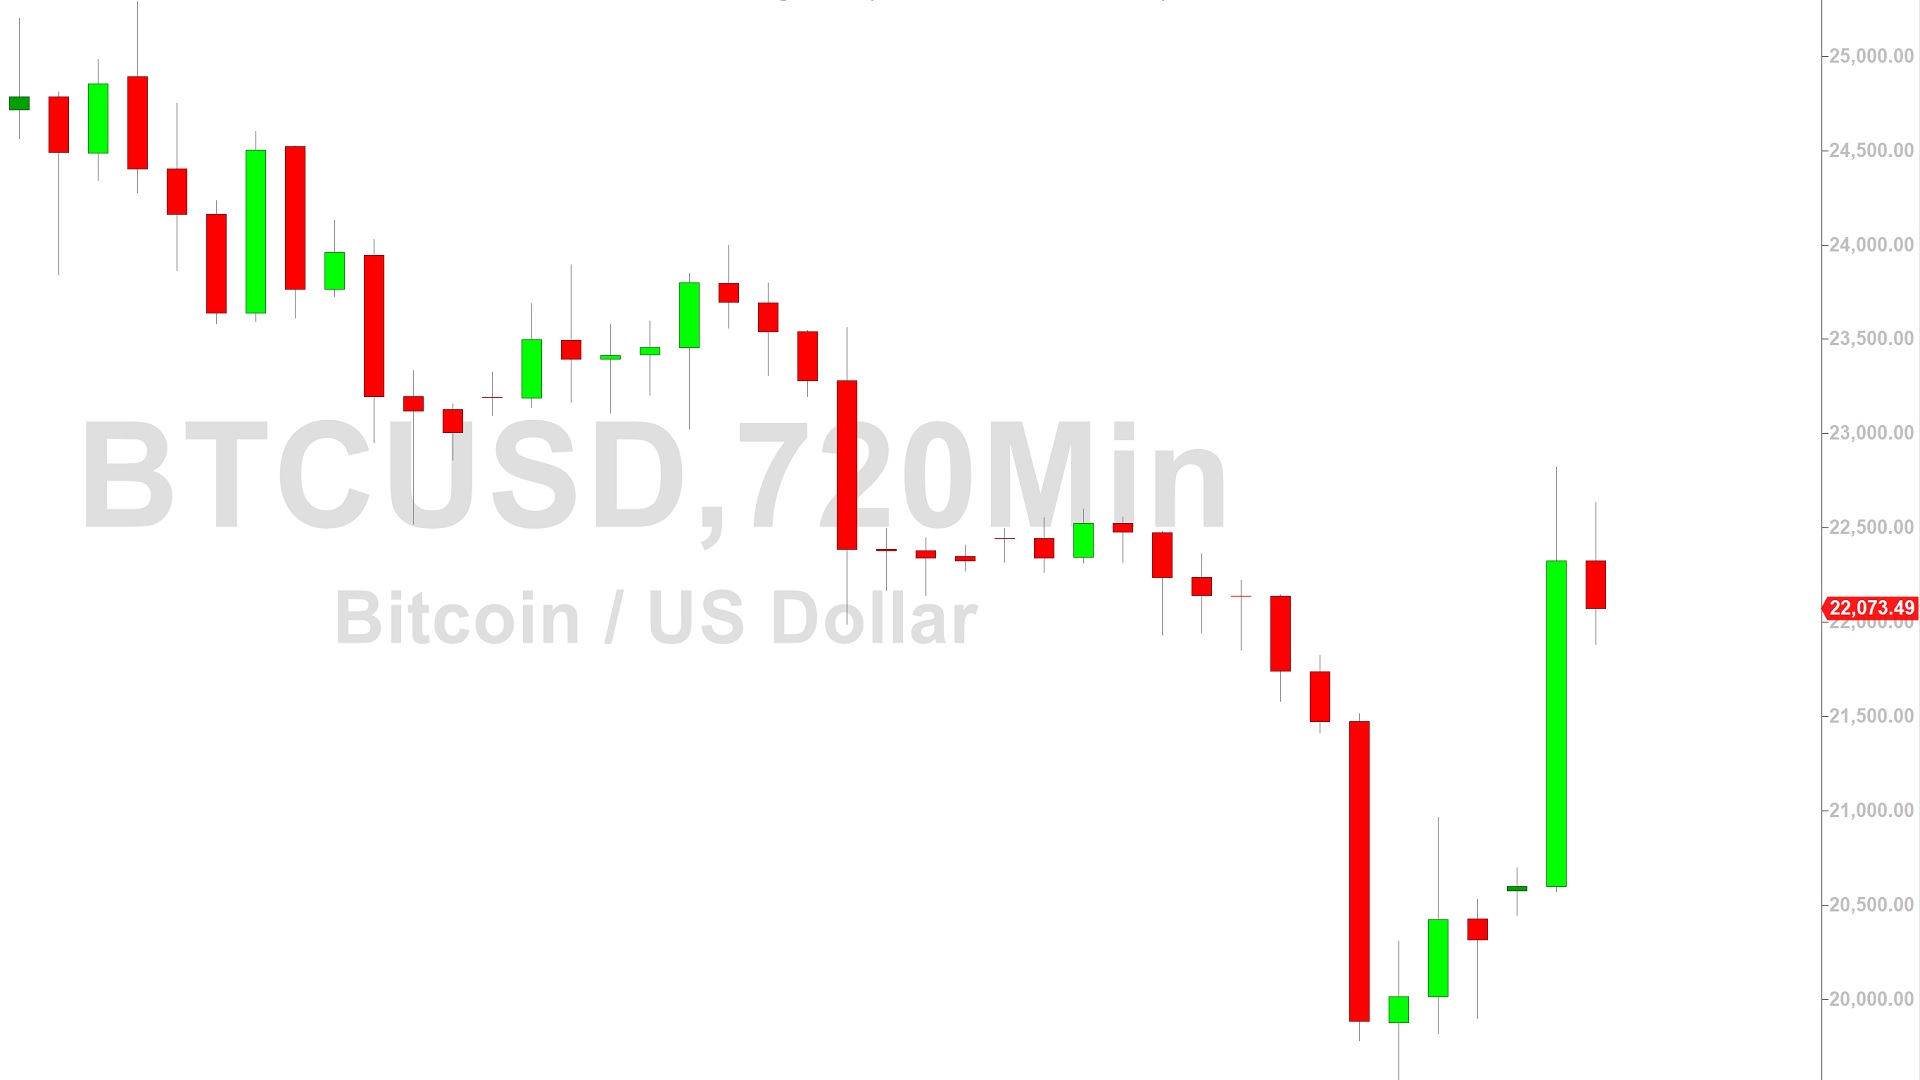
Bitcoin (BTC/USD) pared some recent gains early in the Asian session as the pair hovered around the 22074 level after peaking around the 22832 area on the bounce higher, a test of a price objective that became technically significant following selling pressure around the 24600 area. Stops were executed above the 21753, 22428, 23103, 23938, and 24064 levels during the move higher, upside retracement levels associated with selling pressure that intensified around the 25288 area. Bears recently drove BTC/USD down to the 19568.52 level, its weakest print since mid-January. Stops were elected below the 19886.03 and 19646.70 levels during the depreciation, downside price objectives related to selling pressure around the 24132.67 and 24600.95 areas. Additional downside price objectives include the 19266, 19132, 19106, 19006, 18981, 18919, 18822, 18116, 17720, 17523, 17457, 17230, and 17196 areas.
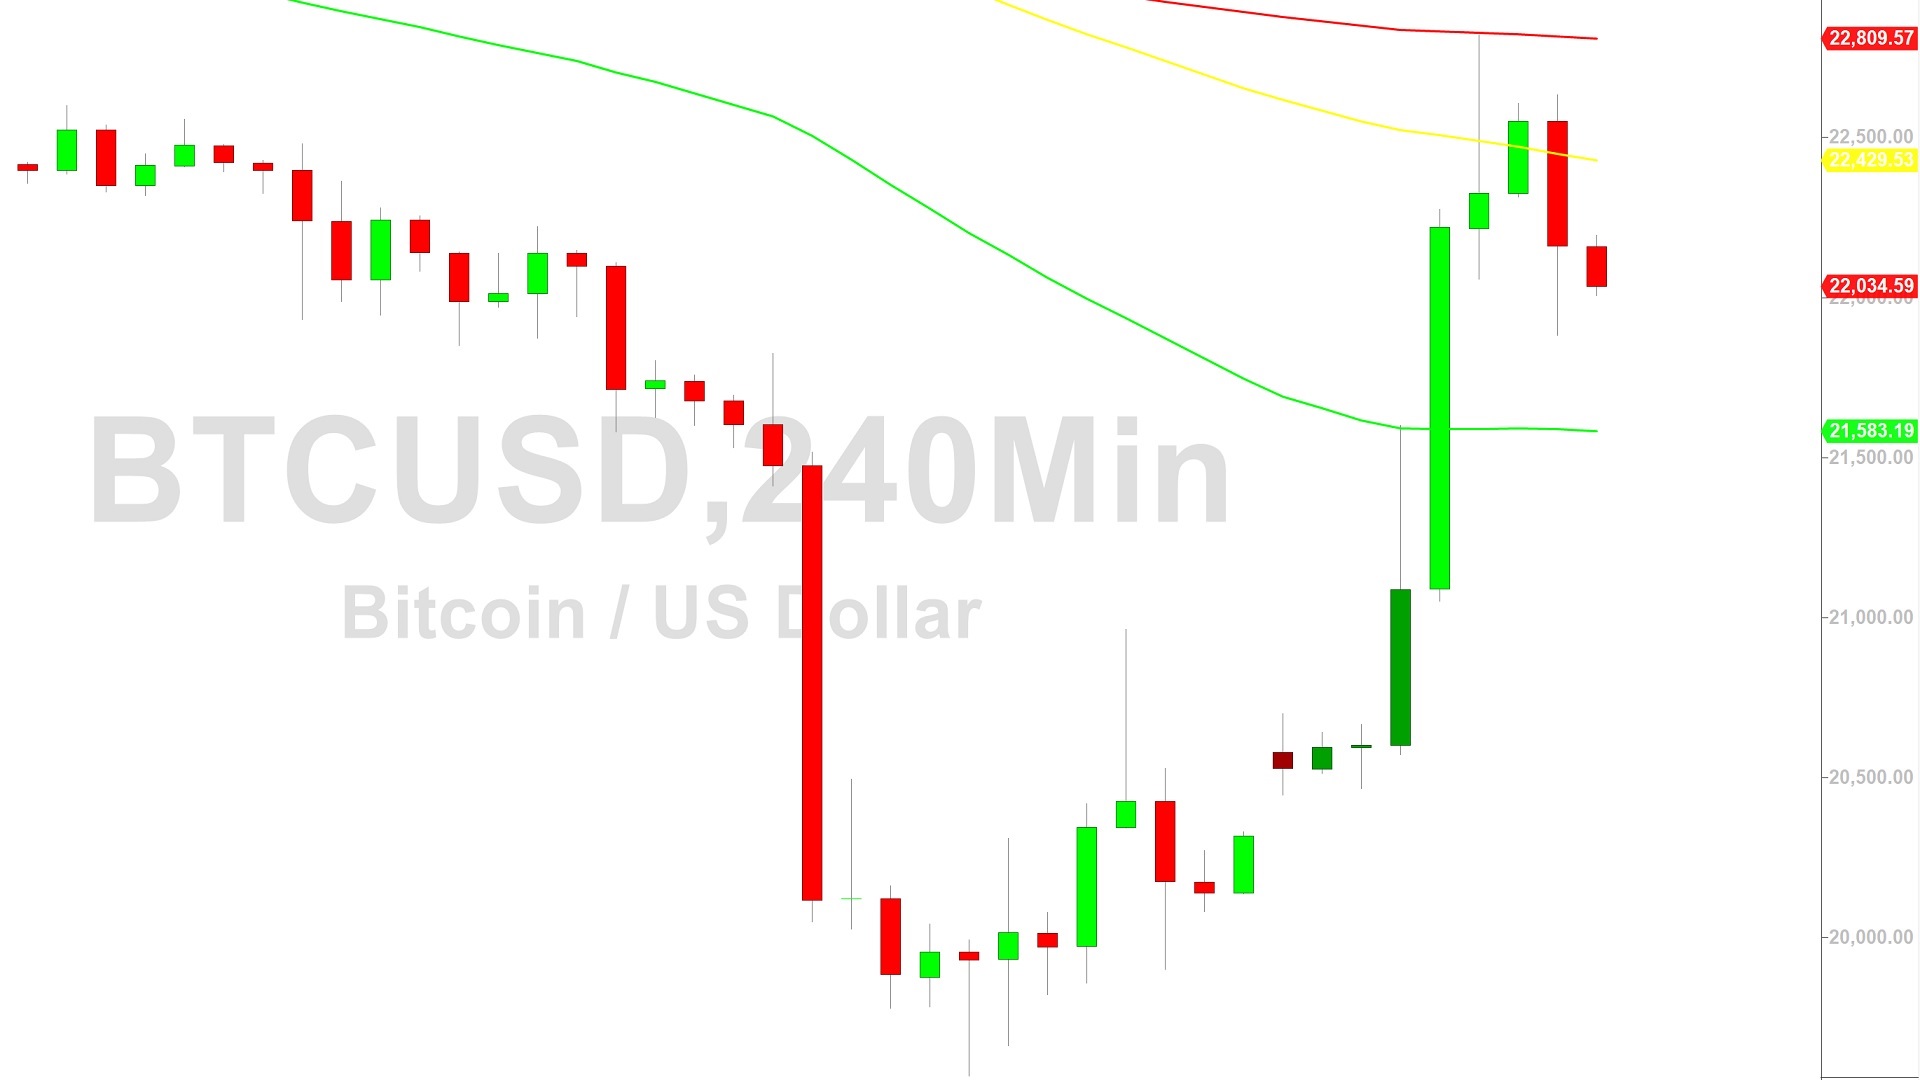
Following the move higher, upside retracement levels and areas of potential selling pressure include the 23103, 23938, and 24064 areas. The recent multi-month high around 25288.88 represented a test of the 25455 level, an upside price objective related to historical buying pressure around the 16326.16 and 20333.33 areas. Below current price activity, technically significant areas include the 15900, 15512, 15313, 14500, 14364, 13369, 10727, 10432, 9682, 8837, and 7538 levels. Traders are observing that the 50-bar MA (4-hourly) is bearishly indicating below the 100-bar MA (4-hourly) and below the 200-bar MA (4-hourly). Also, the 50-bar MA (hourly) is bearishly indicating below the 200-bar MA (hourly) and above the 100-bar MA (hourly).
Price activity is nearest the 100-bar MA (4-hourly) at 22429.71 and the 200-bar MA (Hourly) at 21607.41.
Technical Support is expected around 18390.99/ 16714.46/ 14500.15 with Stops expected below.
Technical Resistance is expected around 25455.06/ 25774.41/ 26612.64 with Stops expected above.
On 4-Hourly chart, SlowK is Bearishly below SlowD while MACD is Bullishly above MACDAverage.
On 60-minute chart, SlowK is Bearishly below SlowD while MACD is Bearishly below MACDAverage.
Disclaimer: Sally Ho’s Technical Analysis is provided by a third party, and for informational purposes only. It does not reflect the views of Crypto Daily, nor is it intended to be used as legal, tax, investment, or financial advice.

Related Stories