Bitcoin Price Analysis: 16780 Resistance Tested - 3 January 2022
BTC/USD Tests 16780 Resistance: Sally Ho’s Technical Analysis – 3 January 2023
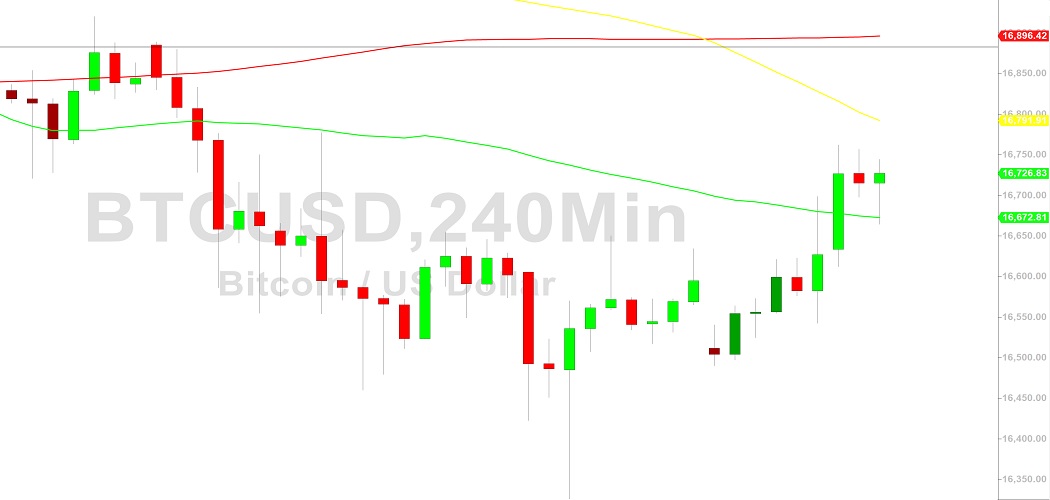
Bitcoin (BTC/USD) worked to extend recent upside progress early in the Asian session as the pair climbed as high as the 16761.92 level, representing a test of the 61.8% retracement of the depreciating range from 17060.86 to 16326.16. Stops were elected above the 16693.51 area during the move higher, a level that represents the 50% retracement of the depreciating range. Traders recently drove BTC/USD as low as the 16326.16 area after Stops were elected below the 16375.18 area, a downside retracement level related to selling pressure around the 18385.36 and 17525 levels. Additional related downside price objectives related to these areas of selling pressure include the 15900, 15313, and 14364 levels. If BTC/USD reclaims some upside momentum, additional technically significant upside retracement levels include the 18495, 19199, 20070, and 20201 levels.
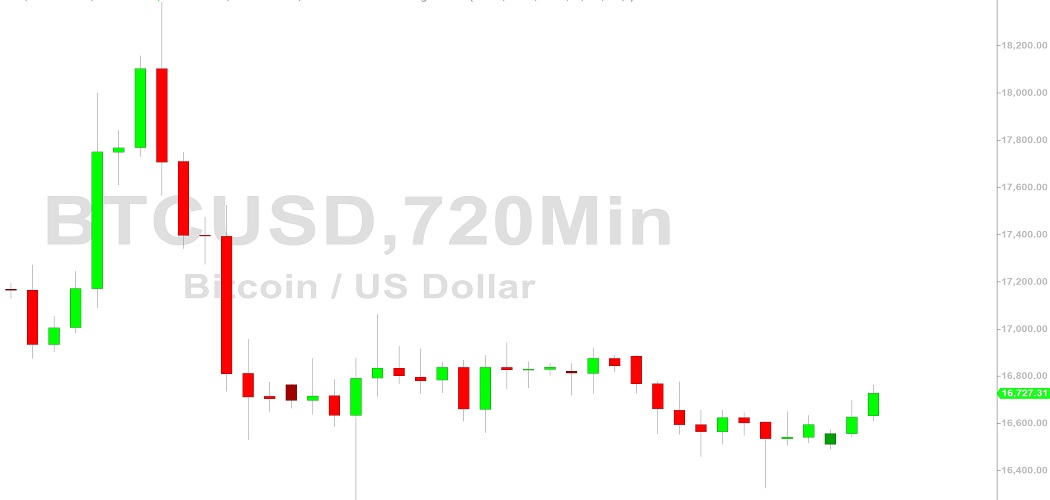
BTC/USD depreciated approximately 64% in 2022, and it was off more than 3% in December. Below current price activity, BTC/USD bears are eyeing a possible test of recent two-year lows around the 15460 area, established after Stops were elected below the 15512 area. Notably, the 15512 level represented an exact bearish price objective based on selling pressure that strengthened around the 21478.80 and 18495.50 areas. Below these areas, technically significant levels include the 14613, 14500.15, 13369, 10432.73, 10727, 9682, 8837, and 7538 levels. Traders are observing that the 50-bar MA (4-hourly) is bearishly indicating below the 100-bar MA (4-hourly) and below the 200-bar MA (4-hourly). Also, the 50-bar MA (hourly) is bearishly indicating below the 200-bar MA (hourly) and above the 100-bar MA (hourly).
Price activity is nearest the 50-bar MA (4-hourly) at 16672.81 and the 200-bar MA (Hourly) at 16672.54.
Technical Support is expected around 14500.15/ 13369.11/ 10727.75 with Stops expected below.
Technical Resistance is expected around 18495.40/ 19199.48/ 20070.64 with Stops expected above.
On 4-Hourly chart, SlowK is Bullishly above SlowD while MACD is Bullishly above MACDAverage.
On 60-minute chart, SlowK is Bullishly above SlowD while MACD is Bullishly above MACDAverage.
Disclaimer: Sally Ho’s Technical Analysis is provided by a third party, and for informational purposes only. It does not reflect the views of Crypto Daily, nor is it intended to be used as legal, tax, investment, or financial advice.

Related Stories