Bitcoin Price Analysis: Longs Eye More Ground - 28 October 2022
BTC/USD Eyeing More Upside: Sally Ho’s Technical Analysis – 28 October 2022
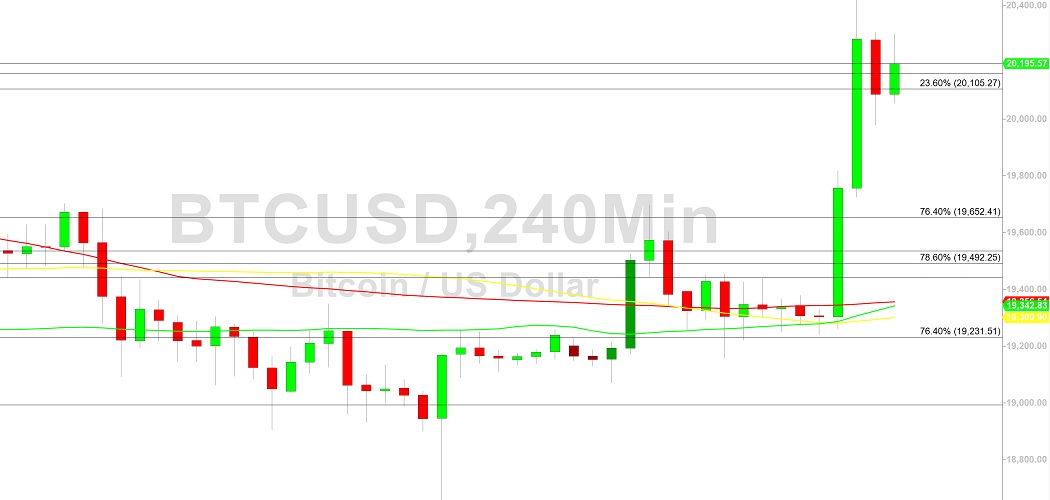
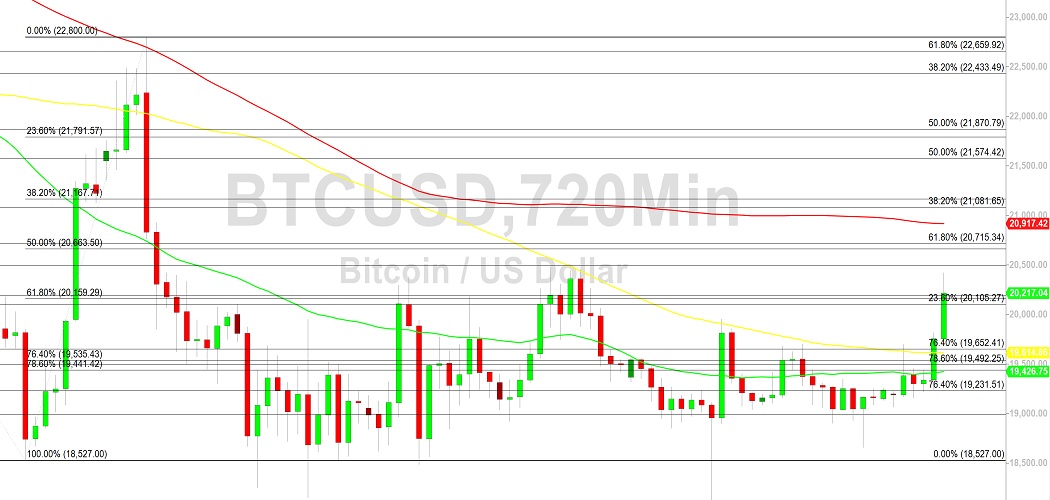
Bitcoin (BTC/USD) bulls looked to reclaim more upside territory early in the Asian session as traders eyed more possible gains above the psychologically-important 20000 figure following the recent test of the 20465.50 area, representing the 50% retracement of the depreciating range from 22800 to 18131. Additional upside retracement levels in this depreciating range include the 21016.44, 21698.12, and 21800.83 areas. Stops were elected above the 19232 and 19914 levels during the recent appreciation higher, and BTC/USD longs are looking to see if upside momentum can be maintained. BTC/USD bears observe larger Stops accumulating below the 17803, 17701, 16966, and 16503 areas, significant technical levels related to historical upside pressure around the 3858 and 9819 levels.
Additional significant technical areas on the downside include the 16990.14, 14500.15, and 10432.73 areas. Following the recent negative sentiment, the 20433 area has been emerging as an area of consistent technical resistance that is technically related to selling pressure that commenced around the all-time high of 69000. Additional upside price objectives and areas of potential selling pressure include the 21574, 22433, 23496, 24577, and 25214 areas. Traders are observing that the 50-bar MA (4-hourly) is bearishly indicating below the 200-bar MA (4-hourly) and above the 200-bar MA (4-hourly). Also, the 50-bar MA (hourly) is bullishly indicating above the 100-bar MA (hourly) and above the 200-bar MA (hourly).
Price activity is nearest the 200-bar MA (4-hourly) at 19371.47 and the 50-bar MA (Hourly) at 19527.19.
Technical Support is expected around 16990.14/ 14500.15/ 10432.73 with Stops expected below.
Technical Resistance is expected around 25256.96/ 27455.20/ 32383.96 with Stops expected above.
On 4-Hourly chart, SlowK is Bullishly above SlowD while MACD is Bullishly above MACDAverage.
On 60-minute chart, SlowK is Bullishly above SlowD while MACD is Bullishly above MACDAverage.
Disclaimer: Sally Ho’s Technical Analysis is provided by a third party, and for informational purposes only. It does not reflect the views of Crypto Daily, nor is it intended to be used as legal, tax, investment, or financial advice.

Related Stories