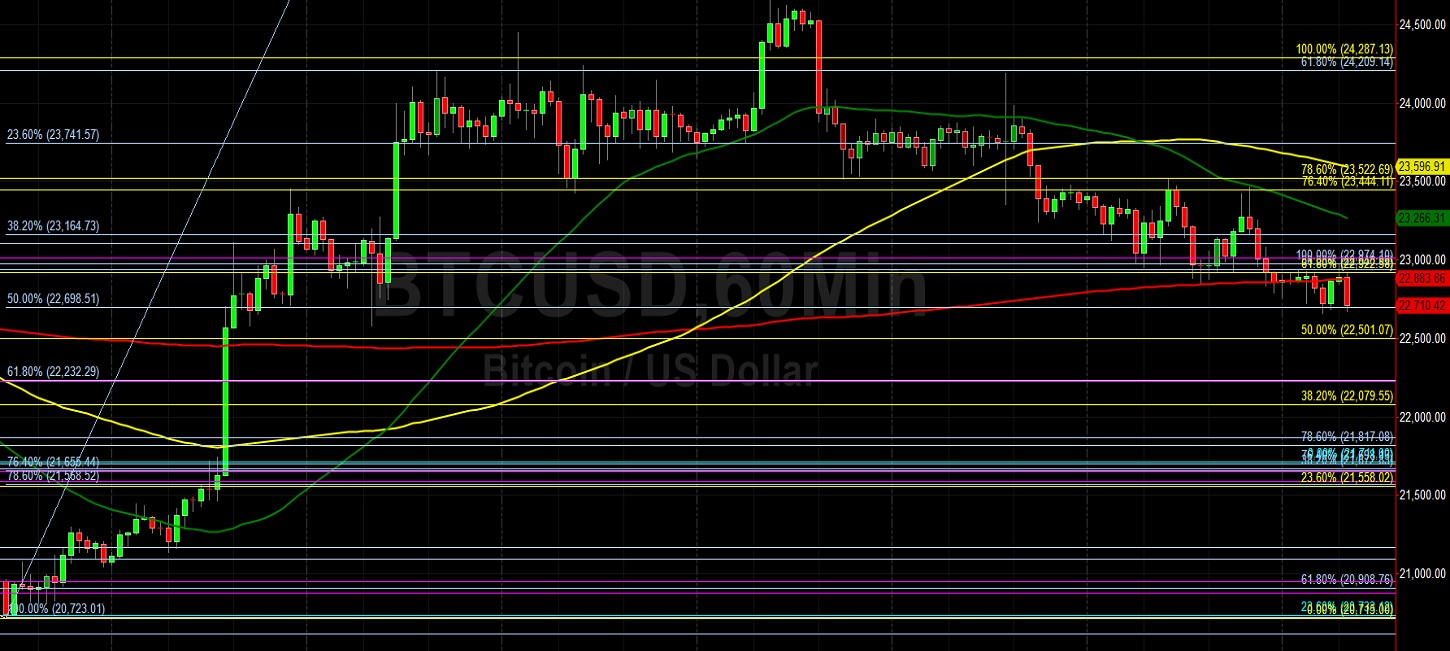
Bitcoin continued to battle selling pressure early in the Asian session as the pair weakened to the 22659.06 level after encountering selling pressure around the 23464.97 area, right around the 50-hour simple moving average. Technical trading activity has been evident during the past several trading sessions when BTC/USD was capped around the 23522 and 23444 levels, representing the 78.6% and 76.4% retracements of the recent depreciating range from 24287.13 to 20715. BTC/USD registered a 15.3% gain in the month of July following a 45.5% tumble in June, and the pair’s 2022 year-to-date performance through the end of July was down 66.7%. The recent move higher to the 24666 area was also a test of the 24558.33 level, representing the 50% retracement of the depreciating range from 31549.21 to 17567.45. Additional upside retracement levels in this depreciating range include the 26208, 28249, and 28557 areas.
Additional upside price objectives and areas of potential selling pressures include the 25552, 26323, 26411, 26901, 27126, 27455, 28426, and 29669 areas. Below recent price activity, possible technical support and areas of buying pressure include the, 22582, 22141, 21596, 20446, 19852, and 19762 levels. Additional significant technical areas on the downside include the 16990.14, 14500.15, and 10432.73 areas. Traders are observing that the 50-bar MA (4-hourly) is bullishly indicating above the 100-bar MA (4-hourly) and above the 200-bar MA (4-hourly). Also, the 50-bar MA (hourly) is bearishly indicating below the 100-bar MA (hourly) and above the 200-bar MA (hourly).
Price activity is nearest the 100-bar MA (4-hourly) at 22717.81 and the 200-bar MA (Hourly) at 22883.71.
Technical Support is expected around 16990.14/ 14500.15/ 10432.73 with Stops expected below.
Technical Resistance is expected around 25256.96/ 27455.20/ 32383.96 with Stops expected above.
On 4-Hourly chart, SlowK is Bearishly below SlowD while MACD is Bearishly below MACDAverage.
On 60-minute chart, SlowK is Bullishly above SlowD while MACD is Bearishly below MACDAverage.
Disclaimer: This trading analysis is provided by a third party, and for informational purposes only. It does not reflect the views of Crypto Daily, nor is it intended to be used as legal, tax, investment, or financial advice.