BTC/USD Ends August on Bearish Note: Sally Ho’s Technical Analysis – 1 September 2022
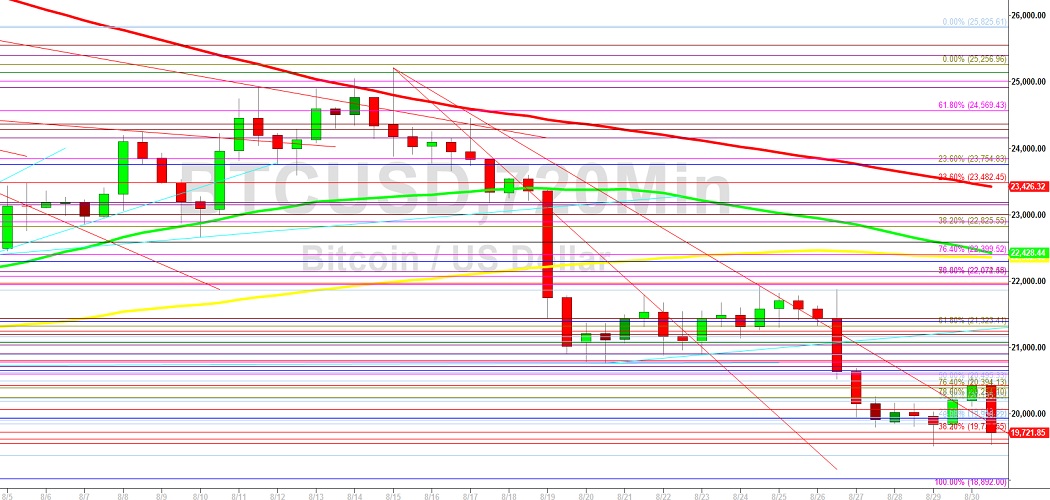
Bitcoin (BTC/USD) remained highly pressured early in the Asian session as the pair remained challenged by the 20867.15 level, an area that represents the 23.6% retracement of the depreciating range from 31549.21 to 17567.45. Traders were unable to get BTC/USD to sustain a short-lived break above the 24558.33 level during the month of August, an area that represents the 50% of this depreciating range. BTC/USD lost approximately 18% in market value in August, and BTC/USD has given back about 81% of its market value year-to-date. Stops were recently elected below the 20174, 20048, 19922, 19766, and 19742 levels during the retracement, representing the appreciating range from 19513.74 to 20582.64. Following the recent selling pressure, additional significant technical areas on the downside include the 16990.14, 14500.15, and 10432.73 areas.
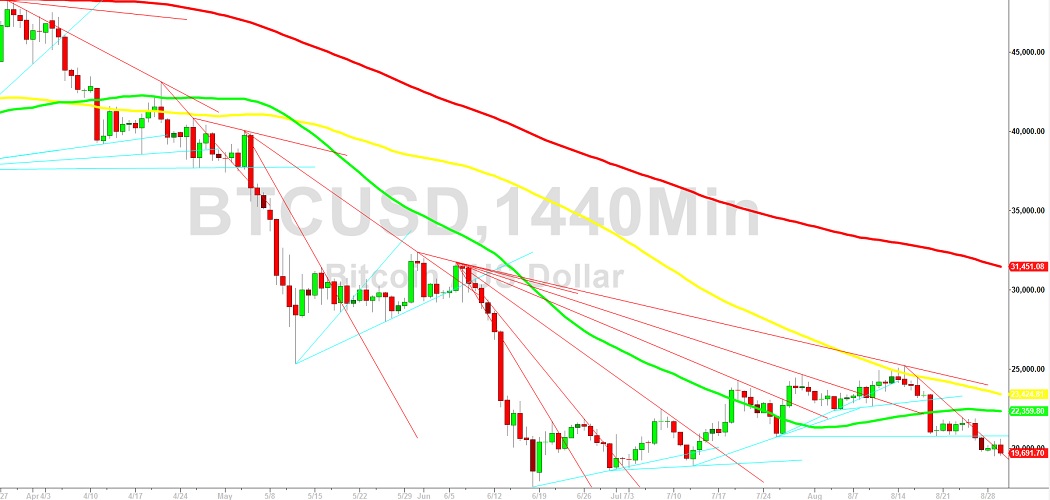
Following stronger episodes of downside pressure, areas of technical resistance and potential selling pressure include the 20619, 20782, 20839, 20887, 21077, 21095, 21387, and 21575 areas. Above recent price activity, upside retracement levels in the depreciating range from 31549.21 to 17567.45 include the 26208, 28249, and 28557 areas. Additional upside price objectives and areas of potential selling pressure include the 25552, 26323, 26411, 26901, 27126, 27455, 28426, and 29669 areas. Traders are observing that the 50-bar MA (4-hourly) is bearishly indicating below the 100-bar MA (4-hourly) and below the 200-bar MA (4-hourly). Also, the 50-bar MA (hourly) is bearishly indicating below the 100-bar MA (hourly) and below the 200-bar MA (hourly).
Price activity is nearest the 50-bar MA (4-hourly) at 20748.44 and the 100-bar MA (Hourly) at 20050.47.
Technical Support is expected around 16990.14/ 14500.15/ 10432.73 with Stops expected below.
Technical Resistance is expected around 25256.96/ 27455.20/ 32383.96 with Stops expected above.
On 4-Hourly chart, SlowK is Bearishly below SlowD while MACD is Bullishly above MACDAverage.
On 60-minute chart, SlowK is Bearishly below SlowD while MACD is Bearishly below MACDAverage.
Disclaimer: Sally Ho’s Technical Analysis is provided by a third party, and for informational purposes only. It does not reflect the views of Crypto Daily, nor is it intended to be used as legal, tax, investment, or financial advice.