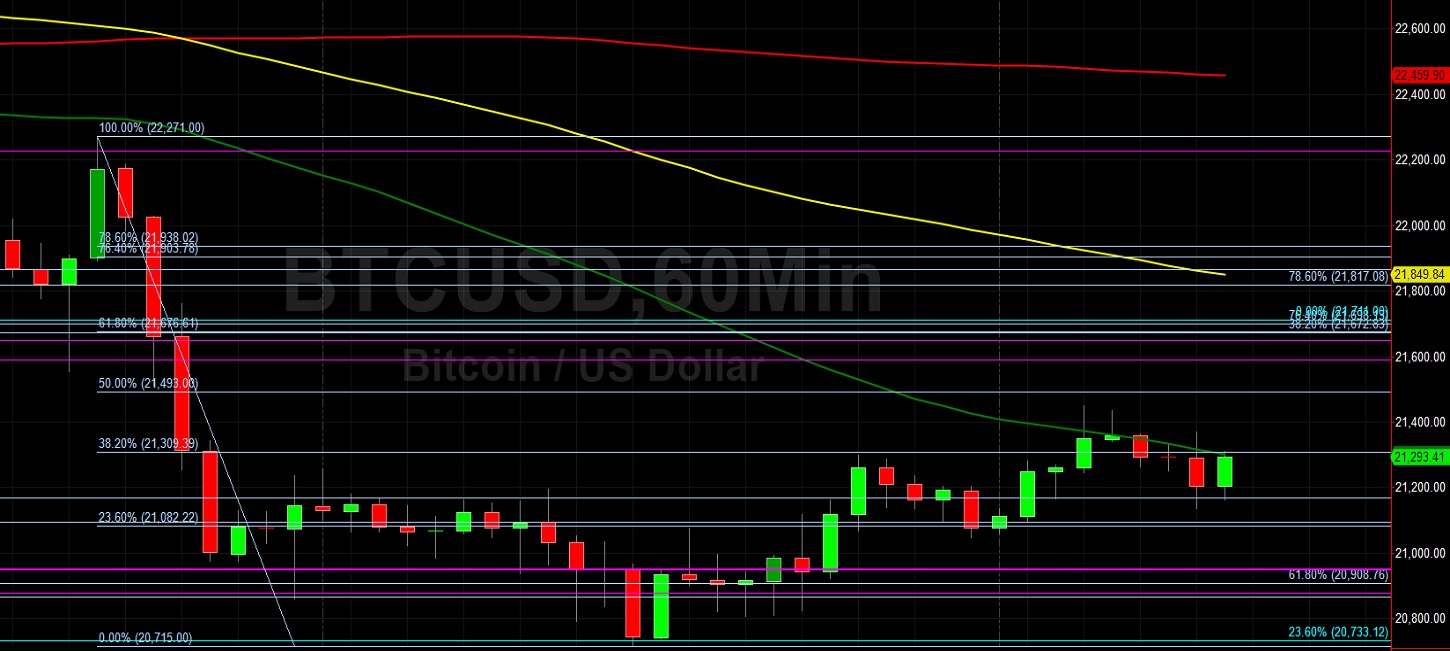
Bitcoin (BTC/USD) worked to reverse its recent downward pressures early in the Asian session as the pair hovered around the 21250 level after recently trading as low as the 20715 area, a test of the 23.6% retracement of the appreciating range from 17567.45 to 21711. Trading activity was recently very technical with recent selling pressure emerging around the 24287.13 area, right around an upside price objective related to buying pressure that recently emerged around the 18892 area. Additional upside price objectives related to this appreciating range include the 25552, 27126, and 29669 levels. Other upside price objectives related to similar recent appreciating ranges include the 25825, 26323, 26411, 26901, 27455, and 28426 areas.
BTC/USD was recently unable to remain above the 21074.87 area, a previous upside price objective related to historical buying pressure that commenced around the 3858 and 9819.83 levels. The technical significance of these upside levels was confirmed when BTC/USD tested the 17787.51 area in mid-June, and additional related price objectives include the 25142.29 and 31717.02 areas. Possible technical support and areas of buying pressure include the 20446, 19852, and 19762 levels. Additional significant technical areas on the downside include the 16990.14, 14500.15, and 10432.73 areas. Traders are observing that the 50-bar MA (4-hourly) is bullishly indicating above the 100-bar MA (4-hourly) and above the 200-bar MA (4-hourly). Also, the 50-bar MA (hourly) is bearishly indicating below the 100-bar MA (hourly) and below the 200-bar MA (hourly).
Price activity is nearest the 200-bar MA (4-hourly) at 21002.12 and the 50-bar MA (Hourly) at 21302.64.
Technical Support is expected around 16990.14/ 14500.15/ 10432.73 with Stops expected below.
Technical Resistance is expected around 24365.11/ 27455.20/ 32383.96 with Stops expected above.
On 4-Hourly chart, SlowK is Bullishly above SlowD while MACD is Bullishly above MACDAverage.
On 60-minute chart, SlowK is Bearishly below SlowD while MACD is Bullishly above MACDAverage.
Disclaimer: This trading analysis is provided by a third party, and for informational purposes only. It does not reflect the views of Crypto Daily, nor is it intended to be used as legal, tax, investment, or financial advice.