Bitcoin (BTC/USD) maintained its improving market bias early in the Asian session as the pair eyed additional upside gains following its recent climb from the 18892 area. Bulls are closely monitoring price activity as BTC/USD approaches the 24806.17 area, an upside retracement level representing the 23.6% retracement of the depreciating range from 48240 to 17567.45. Below that level, the 24558.33 area represents the 50% retracement of the depreciating range from 31549.21 to 17567.45. Additional upside retracement levels in this depreciating range include the 26208, 28249, and 28557 areas, and other areas of potential selling pressure are around the 25778 and 26014 levels.
BTC/USD bulls are looking to see if a constructive base can be maintained above the 21074.87 area, a previous upside price objective related to historical buying pressure that commenced around the 3858 and 9819.83 levels. The technical significance of these upside levels was confirmed when BTC/USD tested the 17787.51 area in mid-June, and additional related price objectives include the 25142.29 and 31717.02 areas. Possible technical support and areas of buying pressure include the 21406, 20926, 20446, 19852, and 19762 levels. Additional significant technical areas on the downside include the 16990.14, 14500.15, and 10432.73 areas. Traders are observing that the 50-bar MA (4-hourly) is bullishly indicating above the 100-bar MA (4-hourly) and above the 200-bar MA (4-hourly). Also, the 50-bar MA (hourly) is bullishly indicating above the 100-bar MA (hourly) and above the 200-bar MA (hourly).
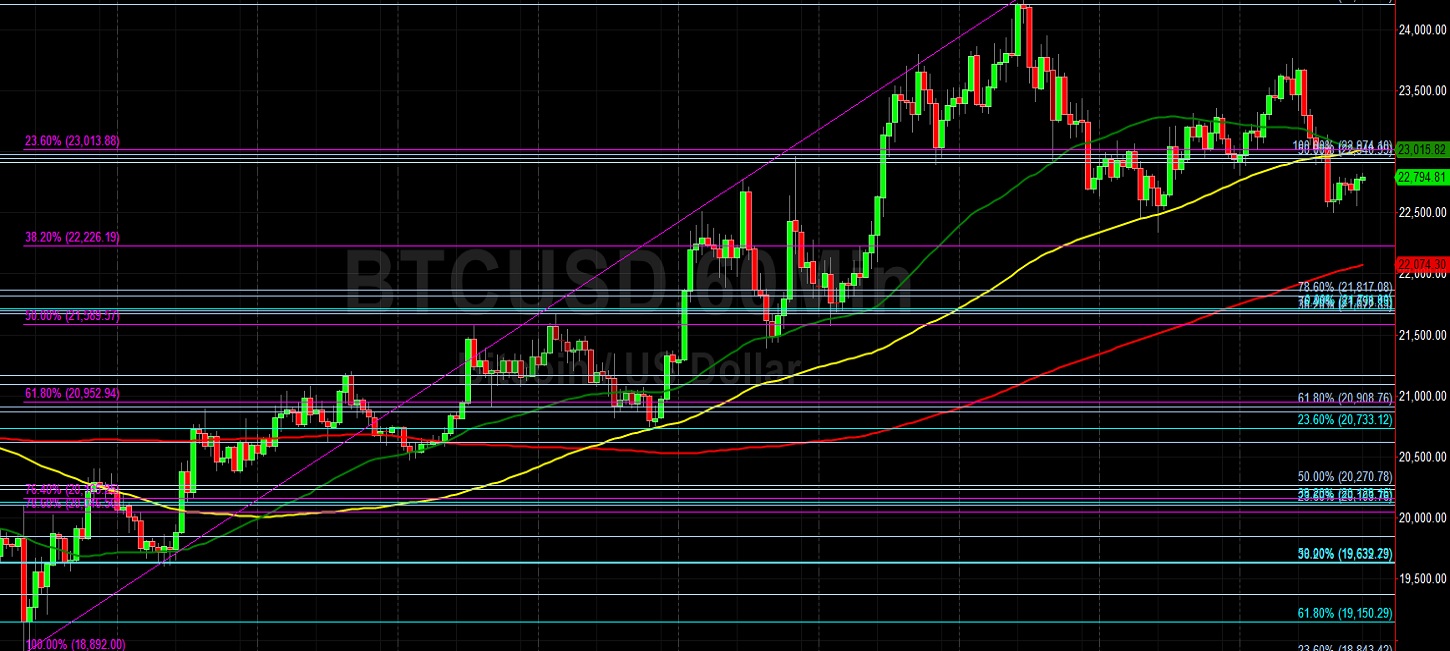
Price activity is nearest the 50-bar MA (4-hourly) at 21974.38 and the 50-bar MA (Hourly) at 23186.47.
Technical Support is expected around 16990.14/ 14500.15/ 10432.73 with Stops expected below.
Technical Resistance is expected around 24365.11/ 27455.20/ 32383.96 with Stops expected above.
On 4-Hourly chart, SlowK is Bullishly above SlowD while MACD is Bearishly below MACDAverage.
On 60-minute chart, SlowK is Bullishly above SlowD while MACD is Bullishly above MACDAverage.
Disclaimer: This trading analysis is provided by a third party, and for informational purposes only. It does not reflect the views of Crypto Daily, nor is it intended to be used as legal, tax, investment, or financial advice.