Bitcoin (BTC/USD) extended its recent downward pressure early in the Asian session as the pair recently printed as low as the 37505.01 area before staging a minor recovery. Significant Stops were elected below the 37821 and 37781 levels, representing the 76.4% and 78.6% retracements of the recent appreciating range from 37401 to 39181.27. This recent low also represented a test of the 38.2% retracement of the depreciating range from 47469.40 to 31257.25. Technical sentiment remains challenging in May following negative sentiment during most of April, when BTC/USD depreciated approximately 17.3% during the month. Buying pressure finally slowed BTC/USD’s descent around a downside price objective related to selling pressure that intensified last month around the 47469.40 area. Stops are likely in place below the 37032, 36302, and 35995 levels.
Additional downside price objectives include the 37151, 37032, 36940, 36302, and 35995 levels. Recent price activity has seen BTC/USD trade below the 38780.48 area, a level that represents the 61.8% retracement of the appreciating range from 32933.33 to 48240. Recent relative lows have also been below the 39600 area, an upside price objective related to historical buying pressure that emerged around the 29301.56 area. Traders are observing that the 50-bar MA (4-hourly) is bearishly indicating below the 100-bar MA (4-hourly) and below the 200-bar MA (4-hourly). Also, the 50-bar MA (hourly) is bearishly indicating below the 200-bar MA (hourly) and above the 100-bar MA (hourly).
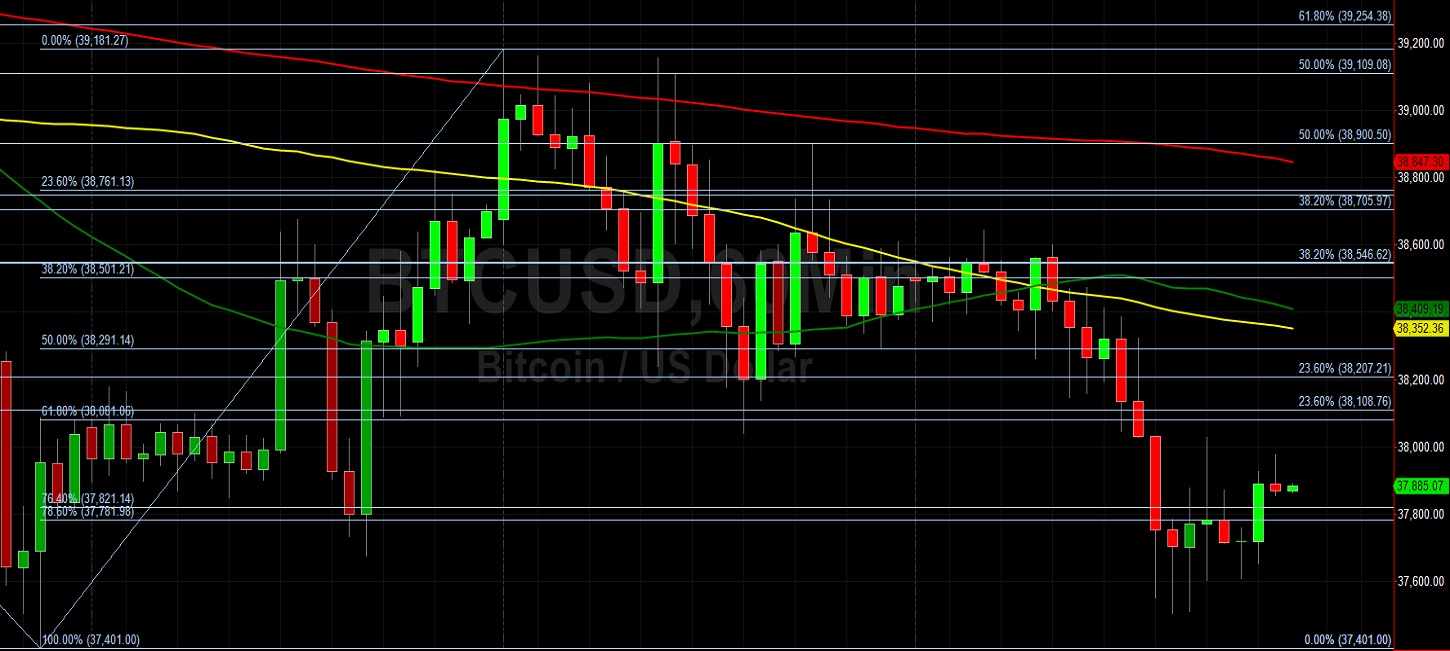
Price activity is nearest the 50-bar MA (4-hourly) at 38805.37 and the 100-bar MA (Hourly) at 38352.29.
Technical Support is expected around 37032.81/ 36302.56/ 35995.52 with Stops expected below.
Technical Resistance is expected around 48574.70/ 50966.67/ 51595.38 with Stops expected above.
On 4-Hourly chart, SlowK is Bearishly below SlowD while MACD is Bearishly below MACDAverage.
On 60-minute chart, SlowK is Bullishly above SlowD while MACD is Bearishly below MACDAverage.
Disclaimer: This trading analysis is provided by a third party, and for informational purposes only. It does not reflect the views of Crypto Daily, nor is it intended to be used as legal, tax, investment, or financial advice.