Bitcoin (BTC/USD) worked to reverse recent selling pressure early in the Asian session as the pair recently traded above the 43000 figure following strong upside activity that emerged around the 38550 level, right around a downside price objective related to selling pressure that strengthened around the 59249.77 area in late 2021. Traders pushed BTC/USD as high as the 43109.47 area before selling pressure emerged. Traders encountered technical resistance around the 41268.44 area during the recent appreciation, representing a test of a downside price objective related to selling pressure that recently emerged around the 47469.40 and 44000 levels. Recent relative highs around the 48240 level resulted in stronger selling pressure around the 47469, 44000, 43443, and 41570 areas, downward pressure that saw the pair cede about half of the multi-week gains it tallied since trading as low as the 32933.33 area in late January. Recent relative lows have been just below the 39363 area, a level that represents a downside price objective relate to selling pressure around the 47469.40 areas.
Upside technical resistance and areas of potential selling pressure include the 41321, 41552, 42012, 42950, 43380, 43564, and 44000 levels. Additional downside price objectives include the 39068, 38832, 38602, 38333, 38062, 37958, 37450, 37151, 37032, 36940, 36302, and 35995 levels. Recent price activity has seen BTC/USD test the 38780.48 area, a level that represents the 61.8% retracement of the appreciating range from 32933.33 to 48240. This relative low was also just below the 39600 area, an upside price objective related to historical buying pressure that emerged around the 29301.56 area. Traders are observing that the 50-bar MA (4-hourly) is bearishly indicating below the 100-bar MA (4-hourly) and below the 200-bar MA (4-hourly). Also, the 50-bar MA (hourly) is bearishly indicating below the 100-bar MA (hourly) and below the 200-bar MA (hourly).
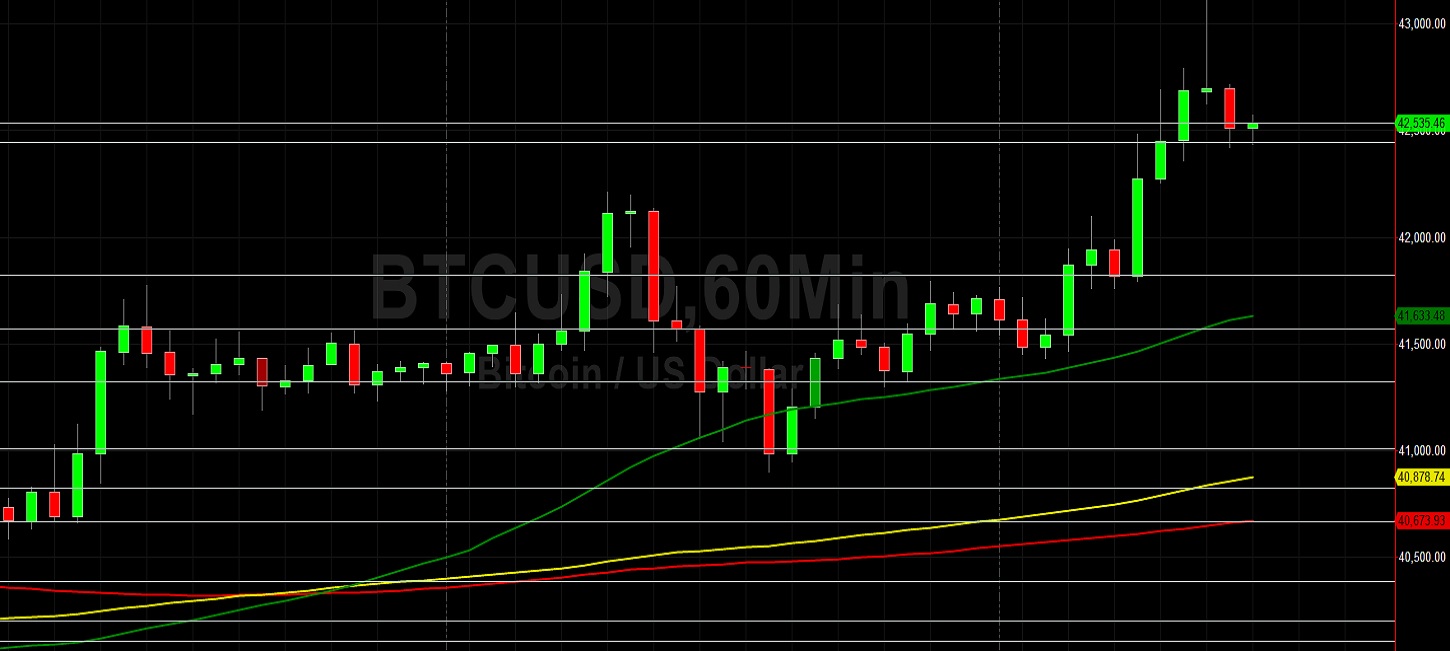
Price activity is nearest the 50-bar MA (4-hourly) at 40378.77 and the 200-bar MA (Hourly) at 40424.18.
Technical Support is expected around 38670.39/ 37797.03/ 34190.77 with Stops expected below.
Technical Resistance is expected around 48574.70/ 50966.67/ 51595.38 with Stops expected above.
On 4-Hourly chart, SlowK is Bullishly above SlowD while MACD is Bullishly above MACDAverage.
On 60-minute chart, SlowK is Bearishly below SlowD while MACD is Bullishly above MACDAverage.
Disclaimer: This trading analysis is provided by a third party, and for informational purposes only. It does not reflect the views of Crypto Daily, nor is it intended to be used as legal, tax, investment, or financial advice.