Bitcoin (BTC/USD) remained challenged above the 44000 figure early in the Asian session as the pair was unable to sustain a test of the 44775.96 level, a move higher that represented a test of the 76.4% retracement of the recent depreciating range from 45855 to 41570. Following the move, BTC/USD then faded lower to the 43677.79 area, representing a test of the 50% retracement of the same depreciating range, before some buying pressure lifted the pair back above the 44000 figure. If BTC/USD is able to resume its upward trajectory, the 44938.01 area remains another technical resistance level. The pair’s recent test of the 41570 area represented a test of a downside price objective related to selling pressure that strengthened around the 57670.68 area in early December.
Another range that traders are monitoring is the appreciation from 32933.33 to 45855, and downside retracement levels include the 40918, 39394, 37869, 35982, and 35698 areas. The recent print around the 45855 level represented a test of the 46091 area, a retracement level related to the broad depreciating range from 59249.77 to 39233.33. If BTC/USD extends its recent upside progress, additional areas of potential selling pressure and technical resistance include the 47576, 47998, 49196, 53039, and 53618 levels. Traders are observing that the 50-bar MA (4-hourly) is bullishly indicating above the 100-bar MA (4-hourly) and above the 200-bar MA (4-hourly). Also, the 50-bar MA (hourly) is bullishly indicating above the 100-bar MA (hourly) and above the 200-bar MA (hourly).
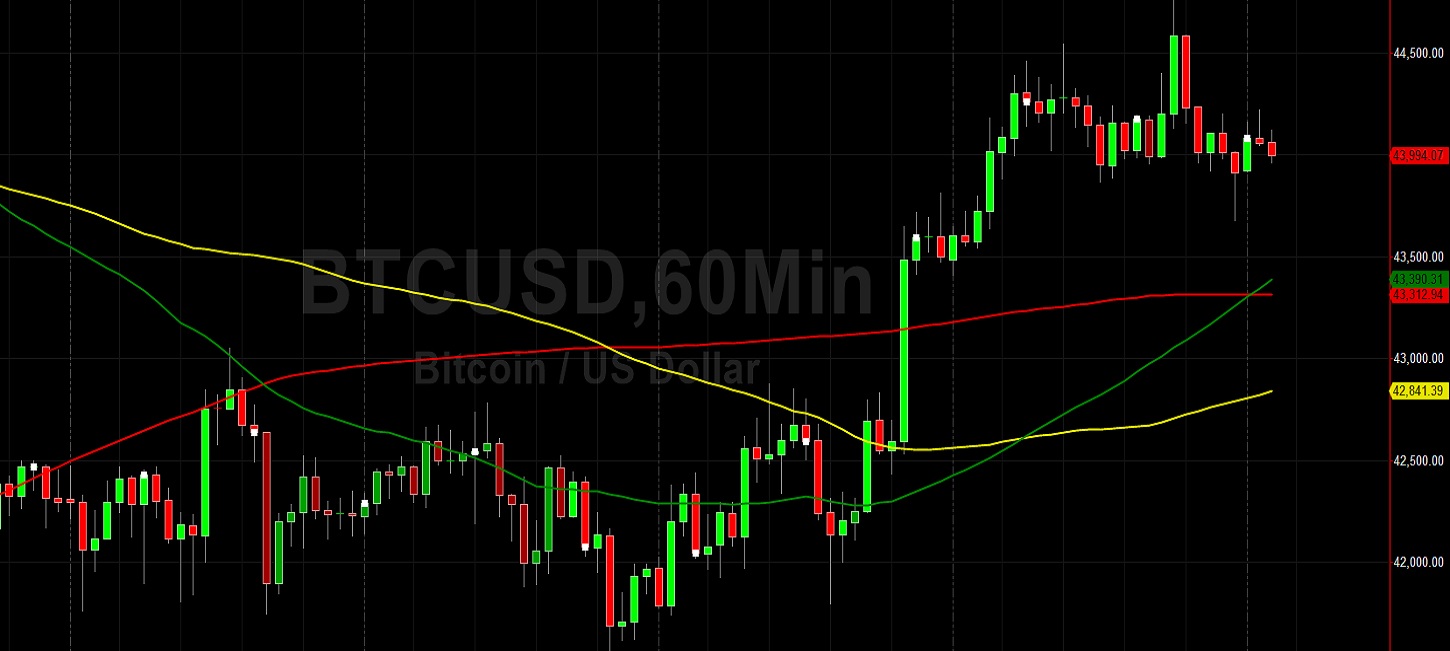
Price activity is nearest the 50-bar MA (4-hourly) at 43328.44 and the 50-bar MA (Hourly) at 43390.52.
Technical Support is expected around 31639.47/ 29514.02/ 27271.02 with Stops expected below.
Technical Resistance is expected around 46600.89/ 47726.76/ 49019.35 with Stops expected above.
On 4-Hourly chart, SlowK is Bearishly below SlowD while MACD is Bullishly above MACDAverage.
On 60-minute chart, SlowK is Bullishly above SlowD while MACD is Bearishly below MACDAverage.
Disclaimer: This trading analysis is provided by a third party, and for informational purposes only. It does not reflect the views of Crypto Daily, nor is it intended to be used as legal, tax, investment, or financial advice.