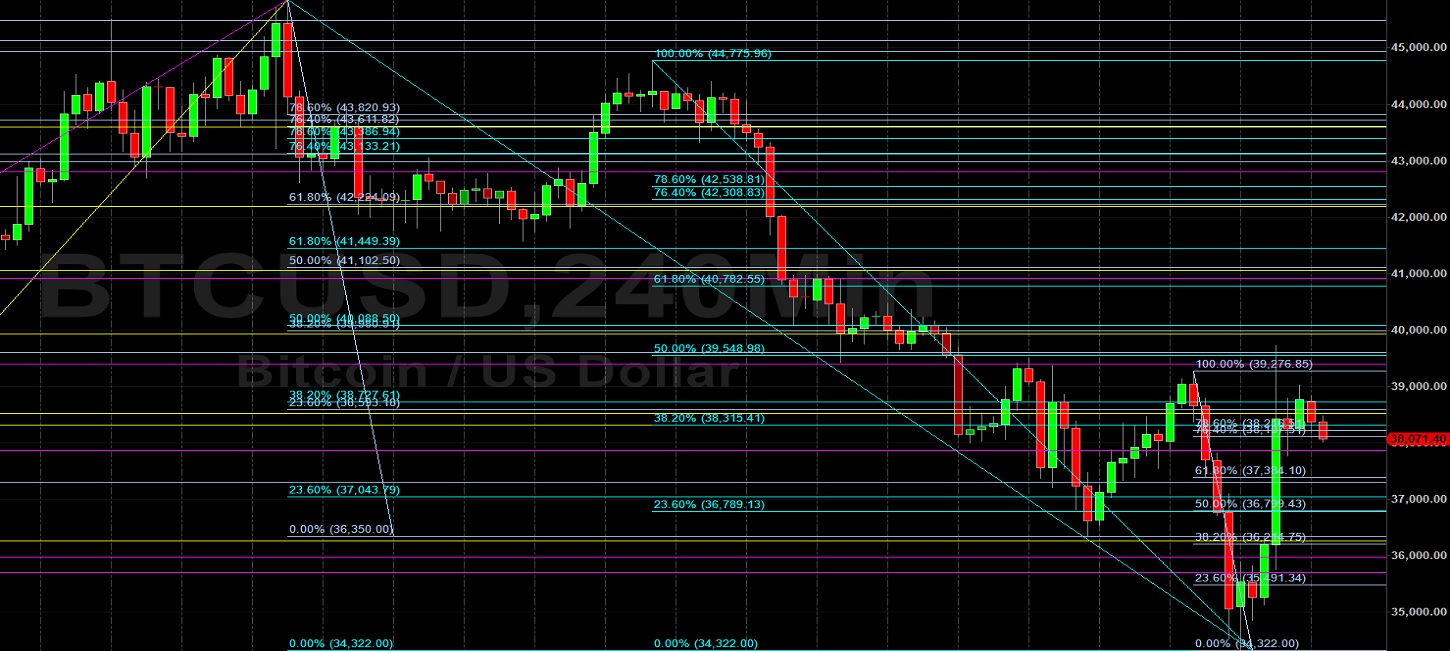
Bitcoin (BTC/USD) reclaimed some lost ground early in the Asian session as the pair moved back above the 38000 figure and peaked around the 39720 level, representing a test of the 50% retracement of the recent depreciating range from 44775.96 to 34222. Stops were elected above the 36789, 37043, 38315, 38727, and 39548 areas during the move higher, upside retracement levels related to recent selling pressure that intensified around the 45855 and 44775.96 levels. Related upside retracement levels include the 39980, 40088, 40782, 41102, 41449, 42224, 42308, 42538, 43133, and 43386 areas. During the recent acute depreciation, Stops were elected below the 35982 and 35698 levels, areas that represent the 76.4% and 78.6% retracements of the appreciating range from 32933.33 to 45855. Additional Stops were also elected below the 38670, 37797, and 35626 levels.
Buying pressure emerged last week after BTC/USD tested the 34165 area, a downside price objective related to selling pressure around the 47076 level. If BTC/USD extends its recent move downward, additional downside price objectives and areas of potential technical support include the 34190, 33724, 33208, 32894, 31639, 29514, 28625, 27721, 25839, and 25217 levels. Traders are observing that the 50-bar MA (4-hourly) is bearishly indicating below the 100-bar MA (4-hourly) and below the 200-bar MA (4-hourly). Also, the 50-bar MA (hourly) is bearishly indicating below the 100-bar MA (hourly) and below the 200-bar MA (hourly).
Price activity is nearest the 50-bar MA (4-hourly) at 38838.89 and the 200-bar MA (Hourly) at 38837.82.
Technical Support is expected around 31639.47/ 29514.02/ 27271.02 with Stops expected below.
Technical Resistance is expected around 46600.89/ 47726.76/ 49019.35 with Stops expected above.
On 4-Hourly chart, SlowK is Bearishly below SlowD while MACD is Bullishly above MACDAverage.
On 60-minute chart, SlowK is Bearishly below SlowD while MACD is Bullishly above MACDAverage.
Disclaimer: This trading analysis is provided by a third party, and for informational purposes only. It does not reflect the views of Crypto Daily, nor is it intended to be used as legal, tax, investment, or financial advice.