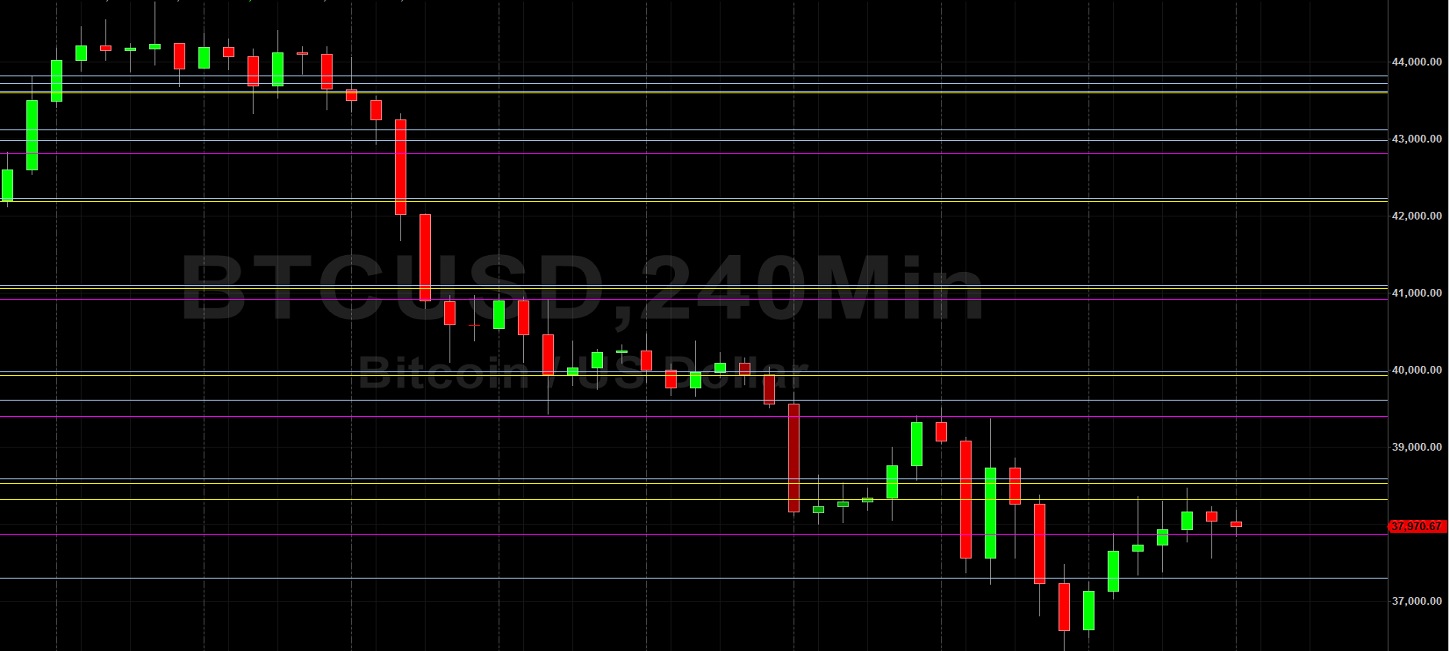
Bitcoin (BTC/USD) tried to sustain a move higher early in the Asian session as the pair continued to orbit the 37869 level after recently trading as low as the 36350 area, a recent relative low that represented a test of the monthly low established in early February. Buying activity lifted BTC/USD to the 38469 area, representing a test of the 76.4% retracement of the appreciating range from 36264.36 to 45855, and also a test of the 23.6% retracement of the depreciating range from 45855 to 36350. Additional upside retracement levels in the latter depreciating range include 39980, 41502, 42224, 43611, and 43820. Stops were elected below the 37689 level during the sharp depreciation early this week, representing the 61.8% retracement of the appreciating range from 32933.33 to 45855.
The technical relevance of this appreciating range was reconfirmed when buying pressure lifted BTC/USD to test the 50% of the range before the depreciation back below the 38000 area. Short-term retracement levels related to the recent depreciating ranges from the 44775 and 40990 areas include the 39495, 39599, and 39848 areas. Following the recent acute selling pressure, areas of technical resistance and potential selling pressure include the 41458, 42298, 42977, 43656, 44496, and 44623 levels. Traders are observing that the 50-bar MA (4-hourly) is bearishly indicating below the 100-bar MA (4-hourly) and above the 200-bar MA (4-hourly). Also, the 50-bar MA (hourly) is bearishly indicating below the 100-bar MA (hourly) and below the 200-bar MA (hourly).
Price activity is nearest the 200-bar MA (4-hourly) at 39751.62 and the 50-bar MA (Hourly) at 37853.22.
Technical Support is expected around 31639.47/ 29514.02/ 27271.02 with Stops expected below.
Technical Resistance is expected around 46600.89/ 47726.76/ 49019.35 with Stops expected above.
On 4-Hourly chart, SlowK is Bullishly above SlowD while MACD is Bullishly above MACDAverage.
On 60-minute chart, SlowK is Bullishly above SlowD while MACD is Bullishly above MACDAverage.
Disclaimer: This trading analysis is provided by a third party, and for informational purposes only. It does not reflect the views of Crypto Daily, nor is it intended to be used as legal, tax, investment, or financial advice.