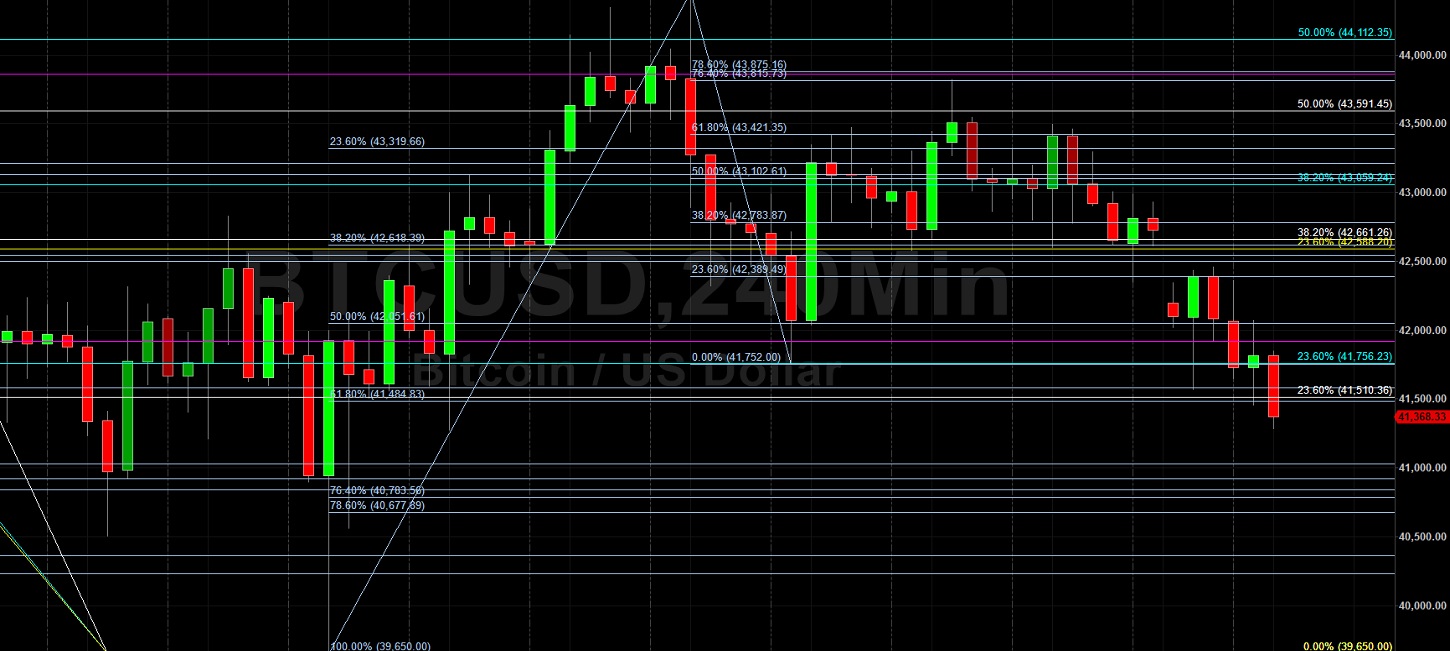
Bitcoin (BTC/USD) continued to lack new conviction early in today’s Asian session as the pair continued to orbit the 43000 level after recently trading as low as the 42353 level, representing a test of the 23.6% retracement of the recent depreciating range from 44453.22 to 41752. Another short-term range that traders are watching is the recent appreciating range from 39650 to 44453.22, with the 42051, 41484, 40703, and 40677 levels representing related downside retracement levels. Traders recently sold BTC/USD down to the 39650 area, its lowest print since September, after Stops were elected below the 46219, 45864, 44655, 43211, 42544, 41583, 41027, and 40842 levels. Additional Stops were triggered below the 46487 and 41583 areas, downside price objectives related to selling pressure that strengthened around the 57670 level.
Stops were also recently elected below a series of downside price objectives including the 46219.09, 45864.66, 45807.18, 44655.08, 44763.46, 43863.32, 43211.49, 43132.91, 42544.70, 42497.20, 41919.46, and 41583.39 levels. If BTC/USD extends its recent depreciation, additional downside price objectives include the 39514, 38832, 38602, 37782, 37593, 37426, 37119, and 35626 levels. Traders are observing that the 50-bar MA (4-hourly) is bearishly indicating below the 100-bar MA (4-hourly) and below the 200-bar MA (4-hourly). Also, the 50-bar MA (hourly) is bullishly indicating above the 100-bar MA (hourly) and above the 200-bar MA (hourly).
Price activity is nearest the 50-bar MA (4-hourly) at 42467.53 and the 50-bar MA (Hourly) at 42961.04.
Technical Support is expected around 39514.35/ 38670.39/ 35734.12 with Stops expected below.
Technical Resistance is expected around 53046.01/ 55157.38/ 55526.67 with Stops expected above.
On 4-Hourly chart, SlowK is Bullishly above SlowD while MACD is Bearishly below MACDAverage.
On 60-minute chart, SlowK is Bullishly above SlowD while MACD is Bullishly above MACDAverage.
Disclaimer: This trading analysis is provided by a third party, and for informational purposes only. It does not reflect the views of Crypto Daily, nor is it intended to be used as legal, tax, investment, or financial advice.