BTC/USD Starts 2022 Following Weak December: Sally Ho's Technical Analysis 1 January 2022 BTC
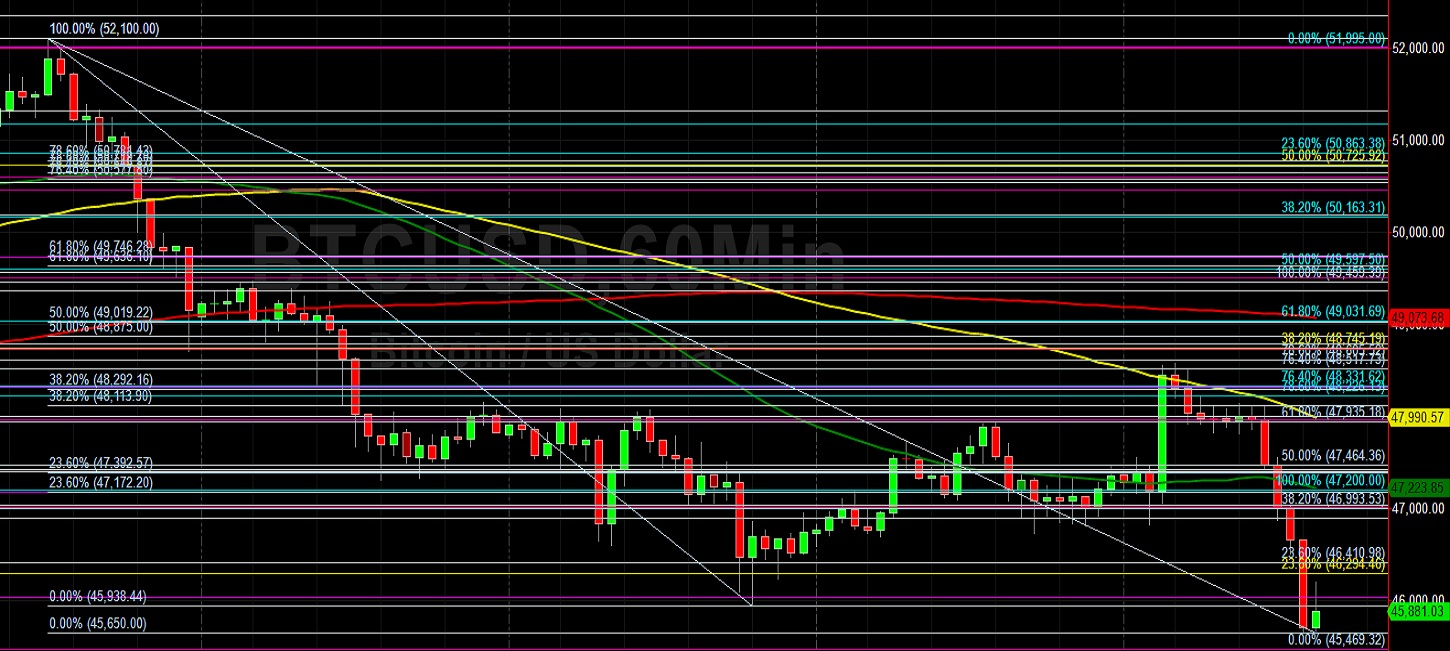
Bitcoin (BTC/USD) sought fresh technical sentiment early in today’s Asian session of the first trading day of 2022 as the pair remains impacted by technical resistance related to selling pressure that emerged in December around the 59118.84 and 57670.68 levels. Trading in 2021 was quite volatile as BTC/USD closed 2021 with approximately a 62% y/y appreciation despite a depreciation of approximately 18% in December alone. BTC/USD opened 2021 around the 29373 level, and this was essentially the pair’s weakest print last year other than a sharp depreciation to the 28800 level in June. Stops were recently elected below the 50535.16, 49567.08, 48784.66, 48002.24, 47034.16, and 46888.29 areas during the pullback, representing the 23.6%, 38.2%, 50%, 61.8%, 76.4%, and 78.6% retracements of the recent appreciating range from 45469.32 to 52100.
Selling pressure commenced around the 59114.84 level in recent weeks and many Stops were elected below downside price objectives during the selling pressure, including the 56533, 56080, 55735, 54295, 54114, 53748, 53600, 53046, 52351, 51322, 51171, 50185, 49361, 47400, 47426, 44974, and 44667 levels. Following the pair’s recent volatility, upside retracement levels and areas of potential technical resistance include the 52706.65, 55157.38, and 55526.67 areas. Traders are observing that the 50-bar MA (4-hourly) is bearishly indicating below the 200-bar MA (4-hourly) and above the 100-bar MA (4-hourly). Also, the 50-bar MA (hourly) is bearishly indicating below the 100-bar MA (hourly) and below the 200-bar MA (hourly).
Price activity is nearest the 100-bar MA (4-hourly) at 48366.54 and the 50-bar MA (Hourly) at 47447.06.
Technical Support is expected around 42151.91/ 38670.39/ 35734.12 with Stops expected below.
Technical Resistance is expected around 53046.01/ 55157.38/ 55526.67 with Stops expected above.
On 4-Hourly chart, SlowK is Bullishly above SlowD while MACD is Bearishly below MACDAverage.
On 60-minute chart, SlowK is Bearishly below SlowD while MACD is Bullishly above MACDAverage.
Disclaimer: This trading analysis is provided by a third party, and for informational purposes only. It does not reflect the views of Crypto Daily, nor is it intended to be used as legal, tax, investment, or financial advice.

Related Stories