Bitcoin (BTC/USD) worked to add to recent upside gains early in the Asian session as the pair has recently traded above the 50725.92 level, representing the 50% retracement of the depreciating range from 59118.84 to 42333. Buying pressure recently emerged around the 48650.02 level, representing a test of the 38.2% retracement of this depreciating range. Negative market sentiment recently pushed BTC/USD as low as the 42333 level, representing the pair’s weakest print since early October. Selling pressure commenced around the 59114.84 level late last week and many Stops were elected below downside price objectives during the selling pressure, including the 56533, 56080, 55735, 54295, 54114, 53748, 53600, 53046, 52351, 51322, 51171, 50185, 49361, 47400, 47426, 44974, and 44667 levels.
Traders are paying close attention to these areas as BTC/USD continues to recover higher, as they may become technical resistance. If BTC/USD extends its recent weakness lower, additional downside price objectives include the 44974, 44667, 42333, 41252, 41053, and 35734 levels. Following the pair’s recent volatility, upside retracement levels and areas of potential technical resistance include the 52706.65, 55157.38, and 55526.67 areas. Traders are observing that the 50-bar MA (4-hourly) is bearishly indicating below the 100-bar MA (4-hourly) and below the 200-bar MA (4-hourly). Also, the 50-bar MA (hourly) is bearishly indicating below the 200-bar MA (hourly) and above the 100-bar MA (hourly).
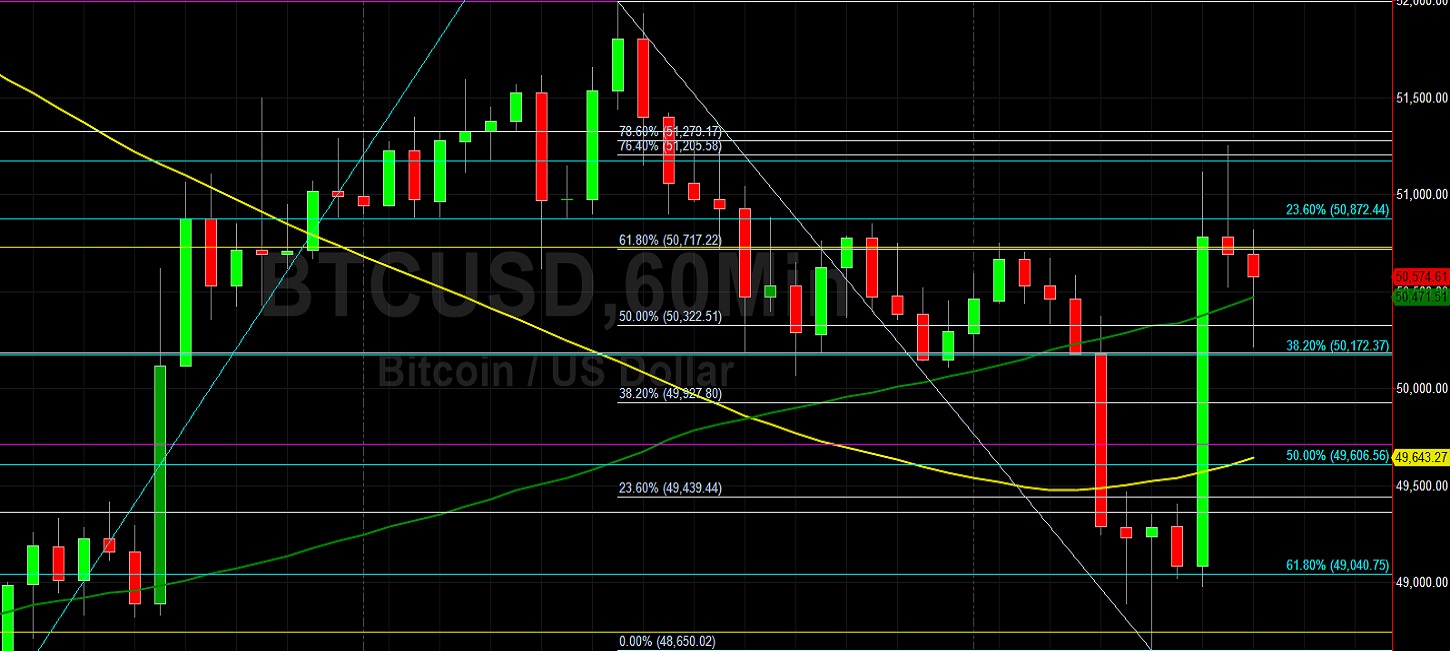
Price activity is nearest the 50-bar MA (4-hourly) at 52634.49 and the 50-bar MA (Hourly) at 50469.31.
Technical Support is expected around 42151.91/ 38670.39/ 35734.12 with Stops expected below.
Technical Resistance is expected around 52706.65/ 55157.38/ 55526.67 with Stops expected above.
On 4-Hourly chart, SlowK is Bearishly below SlowD while MACD is Bullishly above MACDAverage.
On 60-minute chart, SlowK is Bullishly above SlowD while MACD is Bullishly above MACDAverage.
Disclaimer: This trading analysis is provided by a third party, and for informational purposes only. It does not reflect the views of Crypto Daily, nor is it intended to be used as legal, tax, investment, or financial advice.