Ethereum Weekly Roundup: ETH Rapidly Recovers Half Of Its Losses Following Decline By 19%
ETHER RECOVERS MOST OF ITS LOSSES AFTER THIS WEEK'S 19% DIP
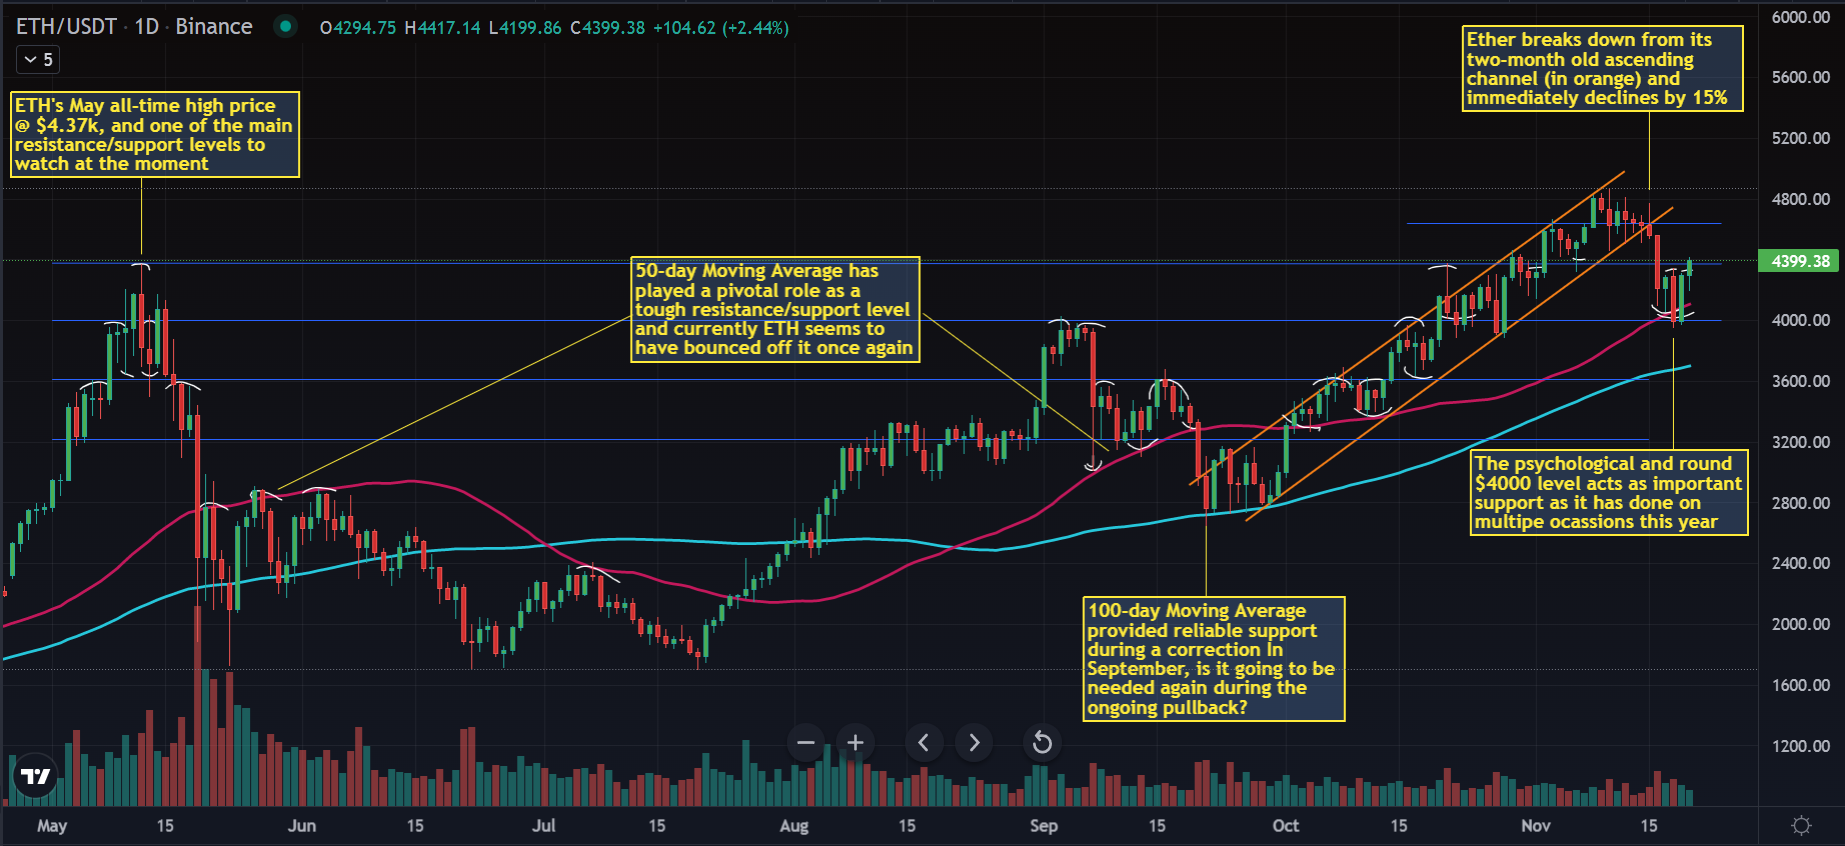
The second largest cryptocurrency by market cap ($525B with ETH dominance at 18.8% compared to Bitcoin's 40.4%) is presently trading a touch above its May ATH of $4382 although it's still 10% down from the current record price, which was set on the 10th of November at $4868. At the time of writing this article Ether (ETH/USDT) has been right in the middle of a price recovery process after briefly falling to an intraday low at $3956 during last Thursday's trading session.
In our opinion an ongoing correction has been triggered by a combination of multiple factors and events: first of all the cryptomarket hadn't had any pullbacks for an unusually prolongued period of time – since September to be exact. Those of us who have been investing in crypto for longer than 6 months should already know to expect similar decreases in their assets' value especially when market sentiments remain overheated for over 5 weeks in a row as was the case until the 15th of November when the Fear & Greed Index finally got reset from over 70 all the way down to mid-30s last Friday and currently it's showing over 40, which still indicates Fear.
Second factor that certainly played a role was an announcement from China that they will launch a ''full-scale'' clampdown on crypto mining. Additionally the communist state's rulers threatened that there will be serious consequences if any institution is found to be abusing its access to subsidized power in order to participate in the mining of digital assets. Now, looking at the Ethereum Network Hash Rate chart we can instantly notice a huge decline by roughly 26% back in May, when the Chinese authorities originally banned mining, which lead to a very deep correction lasting for over two months.
What we don't see in the same chart is any sort of noticeable decrease that has taken place this week. In fact, the ETH Hash Rate power has been steadily increasing for nearly five straight months. Conclusion? The latest Chinese FUD mainly had a purely psychological effect on crypto investors since the great majority of mining rigs have already been moved to countries like the US, Kazakhstan, India etc. What's more, the network is more secure than it's ever been with the current Hash Rate of 846 Terahashes/s compared to May's ATH at 644 Terahashes/s, which represents an improvement by 31.3%.
Another obvious factor that must have played some role in triggering the occuring adjustment in prices of digital assets was the infamous Infrastructure Bill that was expectedly signed by the POTUS Joe Biden last Monday and coincidentally that was the exact same day during which the pullback started. The legislation had been passed by the US Senate a few days earlier and we warned our readers last weekend that it was going to be a red flag for traders that were looking for a new position in the following days or even, touch wood, weeks.
In addition to all of the aforementioned possible triggers a couple of days ago we also had some admittedly worrying reports from India according to which the country's goverments aims to introduce and pass a cryptocurrency law in the parliamentary session that begins as soon as this month. Indian crypto market is one of the leading and fastest growing ones in the world with 15-20 million estimated investors so the alleged and still unofficial plans to tighten regulation of digital assets can quickly turn into another red flag.
TECHNICAL ANALYSIS & ON-CHAIN DATA
Phew, quite a lot of negative information so far, we had better move on to the charts now and start by saying that Ethereum has already recovered half of its losses sustained since the Monday crash. The coin's price bounced off the $4000 mark that was additionally fortified by the near presence of the 50-day MA. As a result Ether is technically still very much in an uptrend in spite of breaking down from an 8-weeks old parallel ascending channel, which was the main focus of our previous article on the asset.
For the time being the main objective is to stay above token's May ATH of $4.37k and gather enough strenght to attempt an attack on $4660, which was one of Ether's previous record levels as well as a rejection point on the 3rd of November subsequently acting as decent support for five days prior to the pullback.
Ultimately Ethereum's price action will obviously depend on Bitcoin (BTC/USDT) and the largest crypto is presently below many of its serious levels of resistance: $60k and 50-day MA to start with, so let's watch what happens there because a potential rejection will definitely bring down the entire cryptomarket as per usual. Last time we promised a bit of info on Ether's on-chain data, and here are some vital conclusions from our analysis:
- Ethereum exchange outflows reached their all-time high this week
- meanwhile the number of ETH's exchange deposits reached a 16-month low
- add 2+2 and what you might see could be an incoming Supply Shock
- the number of ETH addresses depositing to exchanges had a sharp spike prior to the correction but has declined since Monday
- percentage of all ETH addresses that are in profit sits at 97% (from 100% a few days ago) and that's something to bear in mind. Nearly everyone could take profits at any time if they wanted to.
- total number of unique addresses is on a steady increase and has just surpassed 136 million
- Net Unrealized Profit/ Loss ratio is only at 0.65 compared to May's reading at 0.78 before a massive correction so still a long way to go, it would seem.
All in all, the cryptomarket has been sending us really mixed signals this week: on the news front things are looking very sketchy, in the charts indecisive (20% crash followed by a solid recovery) and finally, on-chain data is pointing to Supply Shock in the following weeks/months. Regular updates on Ether each Sunday morning on cryptodaily.co.uk, so stay safe in the markets and see you again soon.
Disclaimer: This article is provided for informational purposes only. It is not offered or intended to be used as legal, tax, investment, financial, or other advice.

Related Stories