Ethereum traded around some technically significant levels early in the Asian session as the pair continued to search for upside momentum following its recent pullback to the 3885.25 level after trading as high as the 4374.95 area. The 3976.14 level is a downside price objective that has recently emerged as technical support after selling pressure intensified around the 4145.84 level. Stops were recently elected below the 4089, 4078, 4046, 4033, 3966, 3906, and 3895 levels during the recent depreciation. Traders recently pushed ETH/USD as high as the 4374.95 area, representing a test of its all-time high around the 4384.43 level from May 2021. Many Stops were recently elected above a series of upside price objectives during the acute move higher including the 4058, 4097, 4151, 4165, 4174, 4190, 4318, 4330, and 4335 levels.
Strong Stops were also elected above the climb higher including the 4003.24 and 4151.87 areas, levels related to buying pressure that recently emerged around the 3373.45 level. Additional upside price objectives include the 4490, 4504, 4523, 4793, and 4893 levels. Following the recent appreciation, downside price retracement levels and areas of potential technical support include the 3748, 3688, 3515, 3375, 3360, 3235, 3082, 3046, 2733, 2345, and 2286 levels. Traders are observing that the 50-bar MA (4-hourly) is bullishly indicating above the 100-bar MA (4-hourly) and above the 200-bar MA (4-hourly). Also, the 50-bar MA (hourly) is bearishly indicating below the 100-bar MA (hourly) and above the 200-bar MA (hourly).
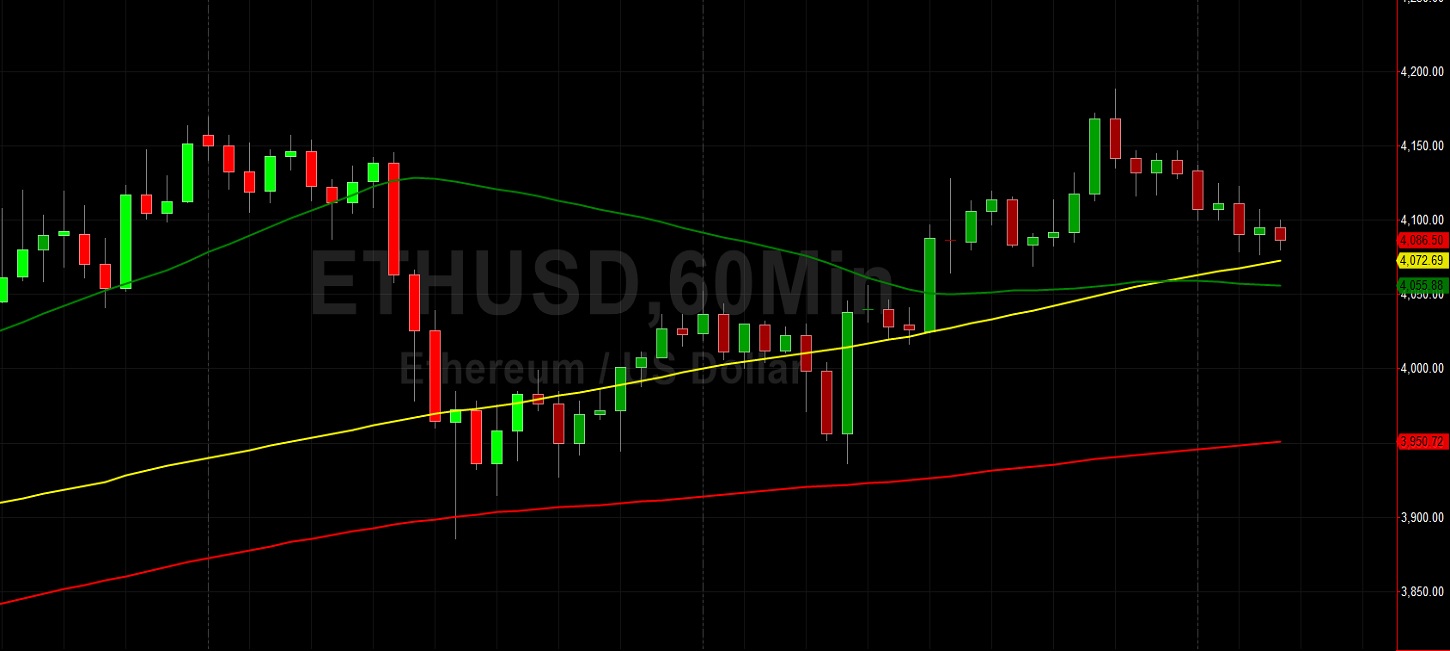
Price activity is nearest the 50-bar MA (4-hourly) at 3955.03 and the 100-bar MA (Hourly) at 4072.70.
Technical Support is expected around 3515.25/ 3375.24/ 3235.23 with Stops expected below.
Technical Resistance is expected around 4384.43/ 4518.94/ 4633.03 with Stops expected above.
On 4-Hourly chart, SlowK is Bearishly below SlowD while MACD is Bearishly below MACDAverage.
On 60-minute chart, SlowK is Bearishly below SlowD while MACD is Bearishly below MACDAverage.
Disclaimer: This trading analysis is provided by a third party, and for informational purposes only. It does not reflect the views of Crypto Daily, nor is it intended to be used as legal, tax, investment, or financial advice.