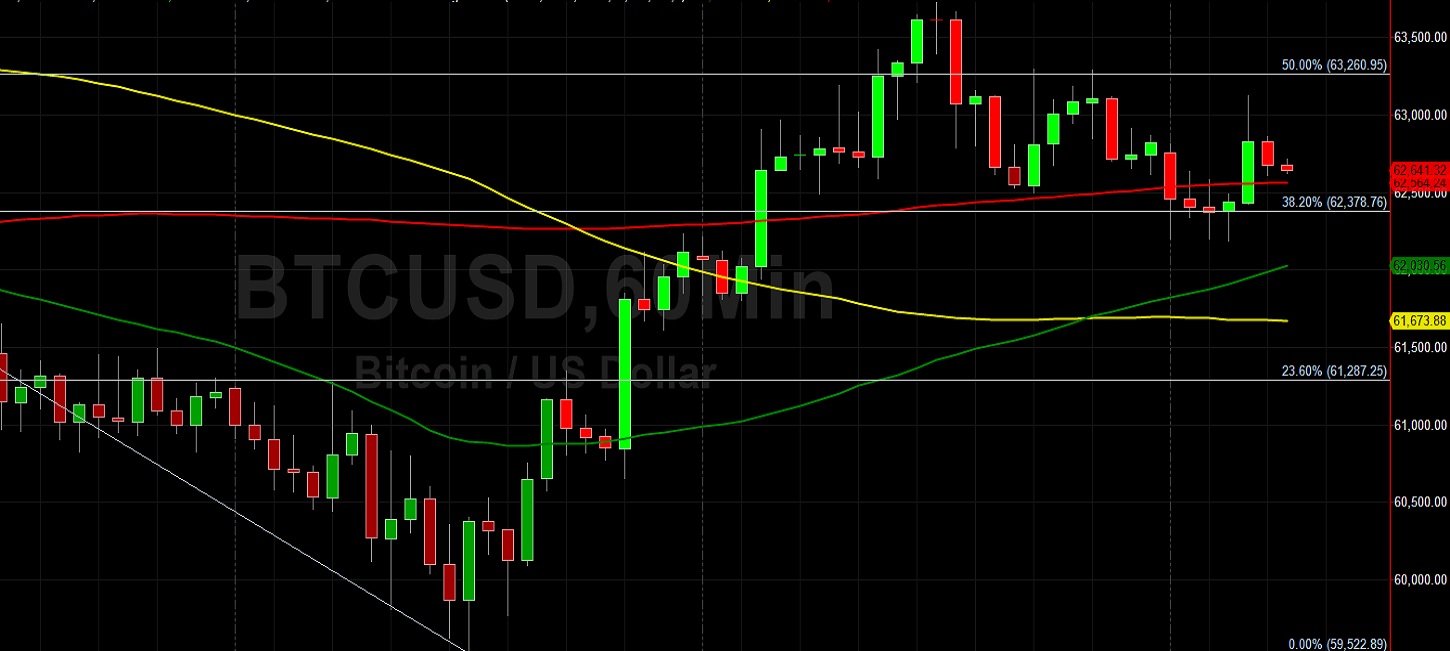
Bitcoin (BTC/USD) awaited fresh market sentiment early in the Asian session as the pair traded as high as the 63126.16 level during the European session after trading as low as the 62183.72 level during the Asian session. Traders lifted BTC/USD as high as the 63726.58 area during yesterday’s North American session, representing a test of the 38.2% retracement of the appreciating range from 58943.83 to 66999, its recent all-time high. Stops were recently elected above the 61287.25 area, representing the 23.6% retracement of the same depreciating range. Additional price retracement levels in the same depreciating range include the 63260, 64143, 65234, and 65399 areas. Traders are paying close attention to technical resistance around the 63750 level, a previous downside price objective related to selling pressure around the 66658 and 66037 levels.
BTC/USD bulls remain focused on upside retracement levels and areas of potential technical resistance including the 67146, 68515, 69449, 71974, and 73245 areas. Following the pair’s recent gains, downside retracement levels and areas of potential technical support include the 63784, 61796, 60189, 58581, 56593, 57627, and 56293 levels. Traders are observing that the 50-bar MA (4-hourly) is bullishly indicating above the 100-bar MA (4-hourly) and above the 200-bar MA (4-hourly). Also, the 50-bar MA (hourly) is bearishly indicating below the 200-bar MA (hourly) and above the 100-bar MA (hourly).
Price activity is nearest the 50-bar MA (4-hourly) at 62569.78 and the 200-bar MA (Hourly) at 62564.27.
Technical Support is expected around 53997.15/ 51245.86/ 49022.22 with Stops expected below.
Technical Resistance is expected around 67146.16/ 68515.32/ 69449.40 with Stops expected above.
On 4-Hourly chart, SlowK is Bearishly below SlowD while MACD is Bullishly above MACDAverage.
On 60-minute chart, SlowK is Bullishly above SlowD while MACD is Bearishly below MACDAverage.
Disclaimer: This trading analysis is provided by a third party, and for informational purposes only. It does not reflect the views of Crypto Daily, nor is it intended to be used as legal, tax, investment, or financial advice.