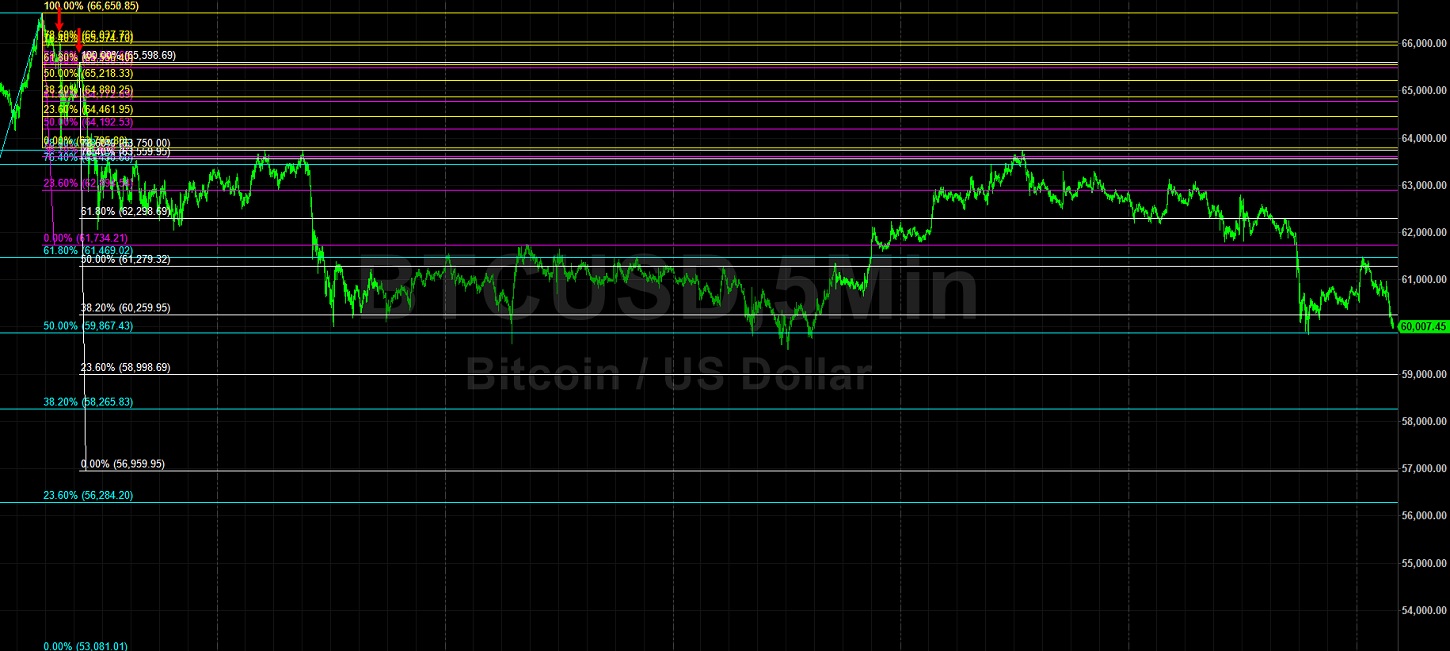
Bitcoin (BTC/USD) remained on the defensive early in the Asian session as the pair continued to trade around the psychologically-important 60000 figure after recently trading as high as the 61488 level, an area that represents a test of a previous downside price objective related to selling pressure that intensified around the 63750 level. The pair recently moved lower to the 59837.07 area during its ongoing depreciation, a level that represents a test of another downside price objective around the 59867 area that is related to the same selling pressure around the 63750 area. Additional downside price objectives include the 59998, 58265, 56959, 56284, and 53081 levels. Traders are paying close attention to technical resistance around the 63750 level, a previous downside price objective related to selling pressure around the 66658 and 66037 levels.
BTC/USD bulls remain focused on upside retracement levels and areas of potential technical resistance including the 67146, 68515, 69449, 71974, and 73245 areas. Following the pair’s recent gains, downside retracement levels and areas of potential technical support include the 63784, 61796, 60189, 58581, 56593, 57627, and 56293 levels. Traders are observing that the 50-bar MA (4-hourly) is bullishly indicating above the 100-bar MA (4-hourly) and above the 200-bar MA (4-hourly). Also, the 50-bar MA (hourly) is bearishly indicating below the 200-bar MA (hourly) and above the 100-bar MA (hourly).
Price activity is nearest the 100-bar MA (4-hourly) at 60643.03 and the 100-bar MA (Hourly) at 61618.36.
Technical Support is expected around 53997.15/ 51245.86/ 49022.22 with Stops expected below.
Technical Resistance is expected around 67146.16/ 68515.32/ 69449.40 with Stops expected above.
On 4-Hourly chart, SlowK is Bearishly below SlowD while MACD is Bearishly below MACDAverage.
On 60-minute chart, SlowK is Bearishly below SlowD while MACD is Bearishly below MACDAverage.
Disclaimer: This trading analysis is provided by a third party, and for informational purposes only. It does not reflect the views of Crypto Daily, nor is it intended to be used as legal, tax, investment, or financial advice.