Bitcoin (BTC/USD) was back on the defensive early in the Asian session as the pair failed to sustain a quick move above the psychologically-important 30000 figure and then moved back below the 32000 figure. Traders observe BTC/USD tested the 100-hour simple moving average during yesterday’s Asian session before coming off, and depreciated to test the 31795.14 level during the North American session, representing a test of the 23.6% retracement of the broad depreciating range from 41322.55 to 28800. The intraweek low of 31600 represents the weakest print since late June, and traders are closely watching how BTC/USD trades around the 31755.32 area, representing the 23.6% retracement of the depreciating range from 41322.55 to 28800.
Traders recently lifted BTC/USD to the 34670 area after Stops were elected above the 34484.12 area, representing the 61.8% retracement of the recent depreciating range from 35951 to 32111. Buying pressure recently emerged around the 33027.83 area, representing a test of the 23.6% retracement of the same depreciating range. Traders observe BTC/USD continues to be offered below the 38236.16 area, a level that represents the 23.6% retracement of the depreciating range from the lifetime high of 64899 to 30000. Traders are observing that the 50-bar MA (4-hourly) is bearishly indicating below the 100-bar MA (4-hourly) and below the 200-bar MA (4-hourly). Also, the 50-bar MA (hourly) is bearishly indicating below the 100-bar MA (hourly) and below the 200-bar MA (hourly).
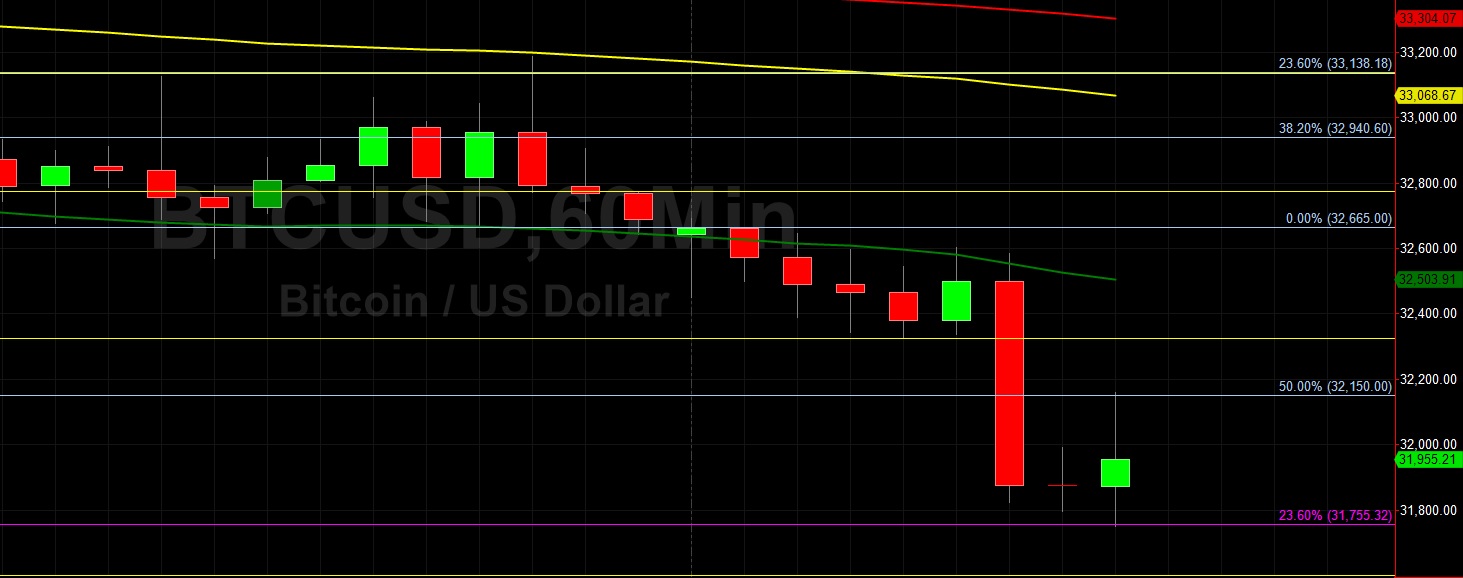
Price activity is nearest the 50-bar MA (4-hourly) at 32243.36 and the 50-bar MA (Hourly) at 32505.41.
Technical Support is expected around 28747.28/ 27706.27/ 27175.66 with Stops expected below.
Technical Resistance is expected around 46000/ 51569.56/ 64899 with Stops expected above.
On 4-Hourly chart, SlowK is Bearishly below SlowD while MACD is Bearishly below MACDAverage.
On 60-minute chart, SlowK is Bearishly below SlowD while MACD is Bearishly below MACDAverage.
Disclaimer: This trading analysis is provided by a third party, and for informational purposes only. It does not reflect the views of Crypto Daily, nor is it intended to be used as legal, tax, investment, or financial advice.