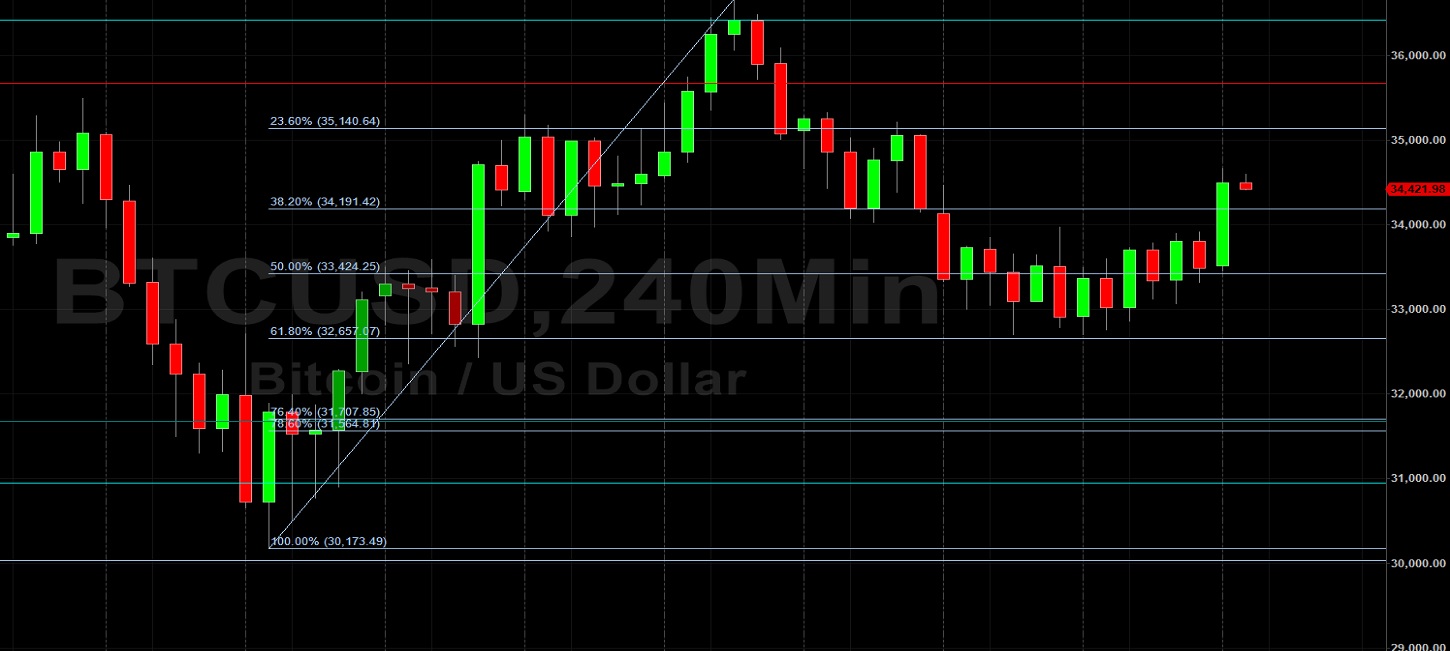
Bitcoin (BTC/USD) sought technical direction early in today’s Asian session as traders continue to eye the 40100.87 area as a very important technical level. Technical support recently lifted BTC/USD around the 32657.07 level, representing the 61.8% retracement of the recent appreciating range from 30173.49 to 36675. The pair has encountered some recent buying pressure at nearby levels of technical support including the 31676.17 and 30950.63 areas. BTC/USD also encountered some selling pressure around areas of technical resistance including the 36424.02 level. Stops were recently elected above strong selling pressure that was recently evident around the 35679.05 level.
If BTC/USD is able to resume its upward trajectory, traders will increasingly focus on areas that recently represented downside price objectives, including the 39444, 40847, 41322, and 44810 levels. Prior to the recent recovery, Stops were recently elected below a series of downside price objectives, including the 31676.16, 30950.63, and 30029.66 areas. Additional downside price objectives include 26980.02, 23052.90, and 22103.23 areas. Traders anticipate large Stops below the 28747.28 level, and their election could open a test of major technical support around the 27706, 27317, 27175, 26593, and 26235 areas. Traders are observing that the 50-bar MA (4-hourly) is bearishly indicating below the 100-bar MA (4-hourly) and below the 200-bar MA (4-hourly). Also, the 50-bar MA (hourly) is bearishly indicating below the 100-bar MA (hourly) and below the 200-bar MA (hourly).
Price activity is nearest the 50-bar MA (4-hourly) at 33770.47 and the 200-bar MA (Hourly) at 33738.90.
Technical Support is expected around 28747.28/ 27706.27/ 27175.66 with Stops expected below.
Technical Resistance is expected around 46000/ 51569.56/ 64899 with Stops expected above.
On 4-Hourly chart, SlowK is Bullishly above SlowD while MACD is Bearishly below MACDAverage.
On 60-minute chart, SlowK is Bullishly above SlowD while MACD is Bullishly above MACDAverage.
Disclaimer: This trading analysis is provided by a third party, and for informational purposes only. It does not reflect the views of Crypto Daily, nor is it intended to be used as legal, tax, investment, or financial advice.