BTC/USD Capped by 31986 Technical Resistance: Sally Ho's Technical Analysis 18 July 2021 BTC
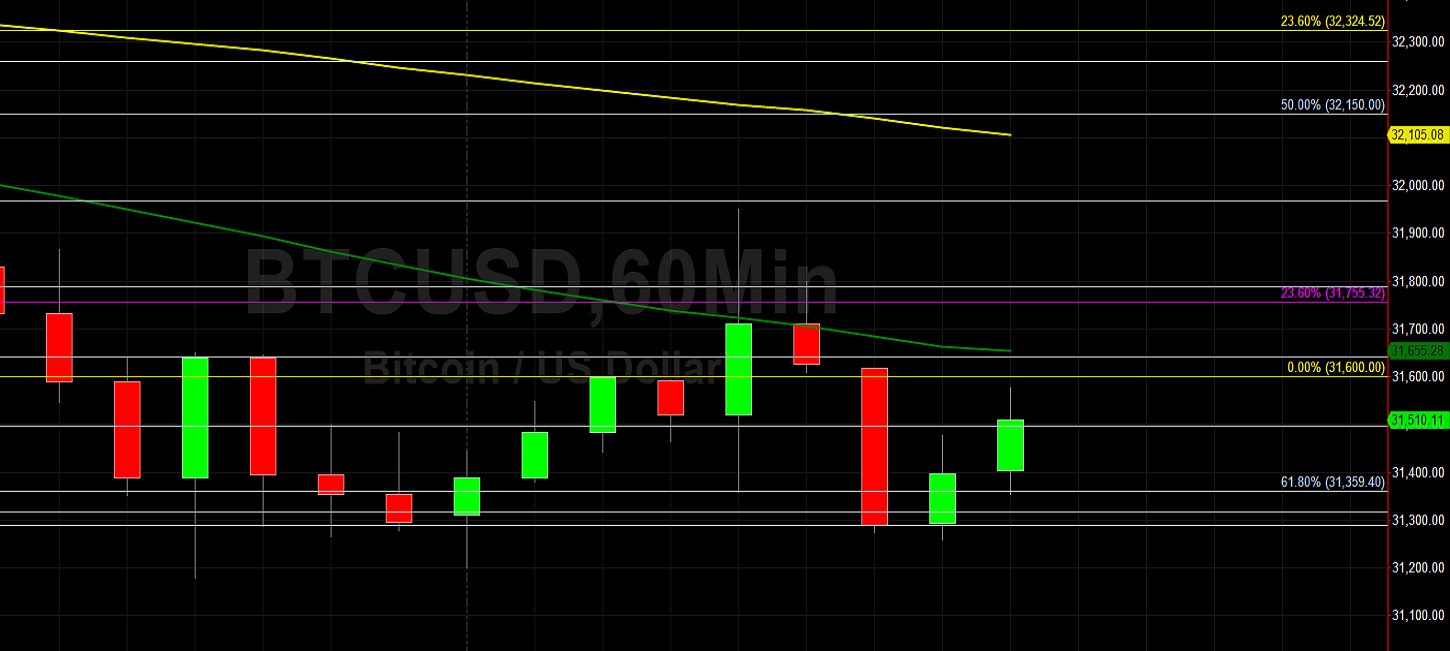
Bitcoin (BTC/USD) extended its sideways trading activity early in the Asian session as the pair continued to orbit the 31755.32 level, an area that represents the 23.6% retracement of the depreciating range from 41322.95 to 28800. Some buying activity emerged just below the 31289.44 area, representing the 78.6% retracement of the appreciating range from 31025.42 to 32259.16. Traders observe BTC/USD traded as high as the 31949.99 area during the European session, representing a test of the 23.6% retracement of the same appreciating range. A recent low around the 31025.42 area represented a test of the 78.6% retracement of a broader appreciating range from 21913.84 to 64899.
Traders recently lifted BTC/USD to the 34670 area after Stops were elected above the 34484.12 area, representing the 61.8% retracement of the recent depreciating range from 35951 to 32111. Buying pressure recently emerged around the 33027.83 area, representing a test of the 23.6% retracement of the same depreciating range. Traders observe BTC/USD continues to be offered below the 38236.16 area, a level that represents the 23.6% retracement of the depreciating range from the lifetime high of 64899 to 30000. Traders are observing that the 50-bar MA (4-hourly) is bearishly indicating below the 100-bar MA (4-hourly) and below the 200-bar MA (4-hourly). Also, the 50-bar MA (hourly) is bearishly indicating below the 100-bar MA (hourly) and below the 200-bar MA (hourly).
Price activity is nearest the 50-bar MA (4-hourly) at 32800.37 and the 50-bar MA (Hourly) at 31654.71.
Technical Support is expected around 28747.28/ 27706.27/ 27175.66 with Stops expected below.
Technical Resistance is expected around 46000/ 51569.56/ 64899 with Stops expected above.
On 4-Hourly chart, SlowK is Bullishly above SlowD while MACD is Bullishly above MACDAverage.
On 60-minute chart, SlowK is Bearishly below SlowD while MACD is Bullishly above MACDAverage.
Disclaimer: This trading analysis is provided by a third party, and for informational purposes only. It does not reflect the views of Crypto Daily, nor is it intended to be used as legal, tax, investment, or financial advice.

Related Stories