Bitcoin (BTC/USD) added to recent gains early in today’s Asian session as the pair appreciated to the 34881.02 area after trading as low as the 33611.01 area during the European session, with the interday low representing a test of the 23.6% retracement of the depreciating range from 42605 to 31111. Traders observe the push to interday highs also represented a test of the 38.2% retracement of the depreciating range from 37325 to 33333. Traders anticipate large Stops below the 28747.28 level, and their election could open a test of major technical support around the 27706, 27317, 27175, 26593, and 26235 areas. Market sentiment remains bearish, and this current dynamic also has technicians focusing on the 25136 and 24200 areas.
Many technical support levels related to broader historic ranges also gave way during the recent acute move lower including the 51375, 51245, 50527, 48478, 47698, 47136, 41581, 40303, and 39604 areas. Upside retracement levels and areas of potential technical resistance include the 41304, 43331, 44796, 47449, 48287, and 51567 levels. Traders are observing the 41304.22 level as potential technical resistance, representing the 38.2% retracement of the recent depreciating range from 59592.20 to 30000. Traders are observing that the 50-bar MA (4-hourly) is bearishly indicating below the 100-bar MA (4-hourly) and below the 200-bar MA (4-hourly). Also, the 50-bar MA (hourly) is bearishly indicating below the 100-bar MA (hourly) and below the 200-bar MA (hourly).
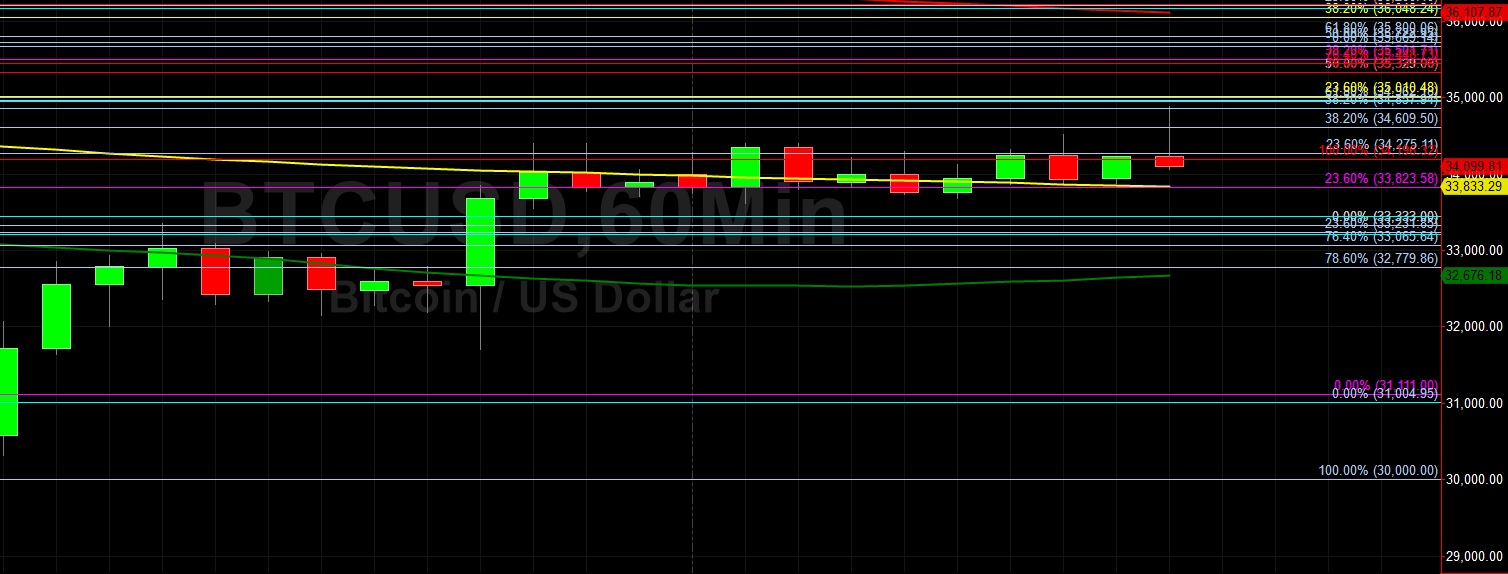
Price activity is nearest the 100-bar MA (4-hourly) at 35996.14 and the 100-bar MA (Hourly) at 33834.08.
Technical Support is expected around 28747.28/ 27706.27/ 27175.66 with Stops expected below.
Technical Resistance is expected around 46000/ 51569.56/ 64899 with Stops expected above.
On 4-Hourly chart, SlowK is Bullishly above SlowD while MACD is Bullishly above MACDAverage.
On 60-minute chart, SlowK is Bearishly below SlowD while MACD is Bullishly above MACDAverage.
Disclaimer: This trading analysis is provided by a third party, and for informational purposes only. It does not reflect the views of Crypto Daily, nor is it intended to be used as legal, tax, investment, or financial advice.