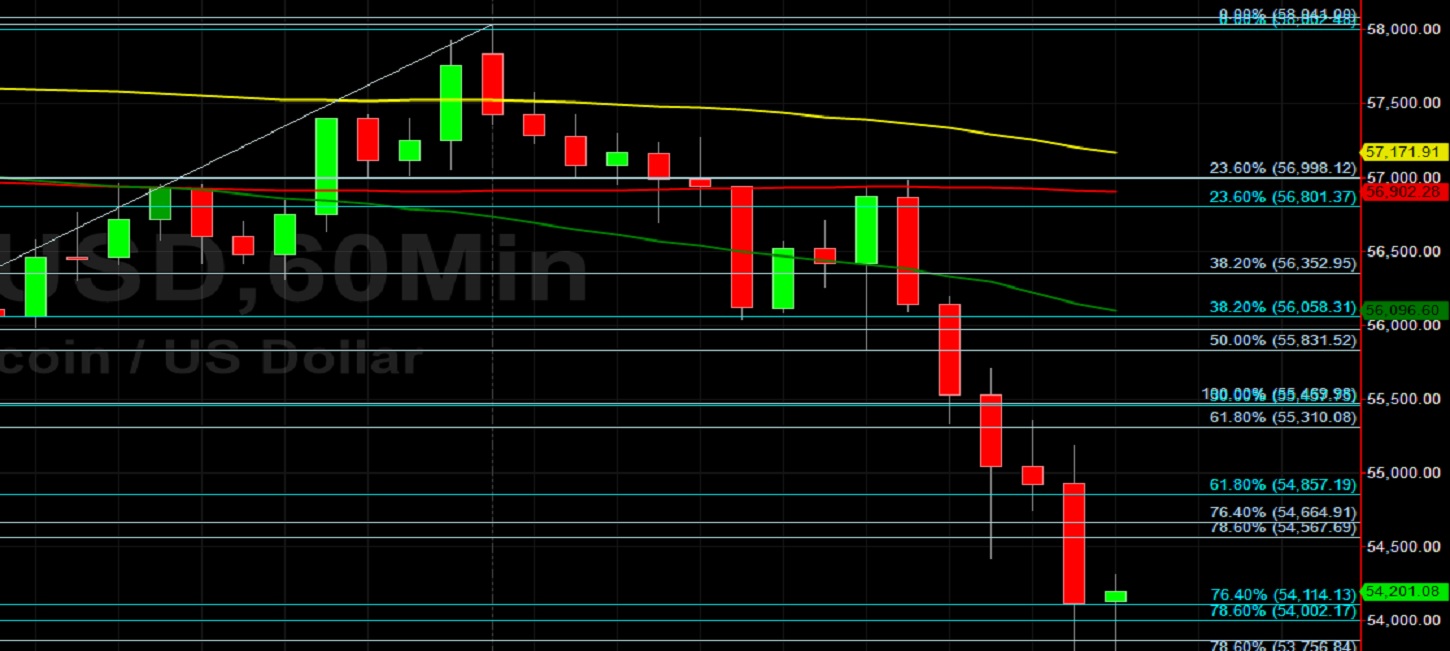
Bitcoin (BTC/USD) slumped early in today’s Asian session as the pair depreciated to the 53560 level after trading as high as the 57574.97 level during the European session, with the interday high representing a test of the 100-hour simple moving average. The sell-off accelerated during the North American session after Stops were elected below the 55831.52 area, representing the 50% retracement of the appreciating range from 53622.03 to 58041. Additional Stops were elected below the 55310.08, 54664.91, and 54567.69 levels, representing the 61.8%, 76.4%, and 78.6% retracements of the appreciating range. Stops were recently elected above the 55971.51 level during the ascent, representing the 50% retracement of the depreciating range from 64899 to 47044.01. The next upside retracement levels in this range include the 60685.22 and 61078.03 areas. The recent lifetime high of 64899 represented a test of the 64835.59 area, an upside price objective that is technically significant based on buying pressure that emerged around the 16200 area.
Significant Stops were also recently elected above multiple upside price objectives during the sharp climb including the 61065.64, 61463.38, 61732.54, and 62026.52 areas, levels related to buying pressure that originated around the 9819.83, 17580, and 16200 areas. Additional upside price objectives include the 66200, 66739.76, 68674.28, and 68973.24 levels, areas related to buying pressure that originated around the 16200, 17580, and 9819.83 levels. Potential technical support areas during pullbacks include the 46219.32, 45472.23, 44900.82, and 44373.66 levels. Traders are observing that the 50-bar MA (4-hourly) is bullishly indicating above the 100-bar MA (4-hourly) and above the 200-bar MA (4-hourly). Also, the 50-bar MA (hourly) is bearishly indicating below the 100-bar MA (hourly) and below the 200-bar MA (hourly).
Price activity is nearest the 100-bar MA (4-hourly) at 56296.55 and the 50-bar MA (Hourly) at 56094.69.
Technical Support is expected around 47044.01/ 46556.35/ 41851.15 with Stops expected below.
Technical Resistance is expected around 64899/ 66200/ 66739.76 with Stops expected above.
On 4-Hourly chart, SlowK is Bearishly below SlowD while MACD is Bearishly below MACDAverage.
On 60-minute chart, SlowK is Bullishly above SlowD while MACD is Bearishly below MACDAverage.
Disclaimer: This trading analysis is provided by a third party, and for informational purposes only. It does not reflect the views of Crypto Daily, nor is it intended to be used as legal, tax, investment, or financial advice.