Bitcoin (BTC/USD) glided higher early in today’s Asian session as the pair appreciated to the 51569.56 level after trading as low as the 48951.86 level during the European session, with the interday low representing a test of the 38.2% retracement of the recent depreciating range from 59592.20 to 46000. Traders observe the recent low of 46000 was a test of the 45574 area, representing the 38.2% retracement of the recent appreciating range from 14310 to 64899. Stops were elected below many downside price objectives related to recent selling pressure around the 59592.20 area, including the 55976, 55123, and 54067 levels. Larger Stops were elected below downside price objectives related to selling pressure that emerged in April at the new all-time high of 64899 and the recent 59592.20 area, including the 52658 and 48877 areas. Additional downside price objectives related to this selling pressure include the 45071 and 40406 levels.
Many technical support levels related to broader historic ranges also gave way during the recent acute move lower including the 51375, 51245, 50527, 48478, 47698, and 47136 areas. Additional areas of potential technical support include the 43406, 42809, 42307, 41581, 40303, and 39604 areas. The recent lifetime high of 64899 represented a test of the 64835.59 area, an upside price objective that is technically significant based on buying pressure that emerged around the 16200 area. During the recent appreciation, significant Stops were elected above multiple upside price objectives including the 61065.64, 61463.38, 61732.54, and 62026.52 areas, levels related to buying pressure that originated around the 9819.83, 17580, and 16200 areas. Additional upside price objectives include the 66200, 66739.76, 68674.28, and 68973.24 levels, areas related to buying pressure that originated around the 16200, 17580, and 9819.83 levels. Traders are observing that the 50-bar MA (4-hourly) is bearishly indicating below the 200-bar MA (4-hourly) and below the 100-bar MA (4-hourly). Also, the 50-bar MA (hourly) is bearishly indicating below the 100-bar MA (hourly) and below the 200-bar MA (hourly).
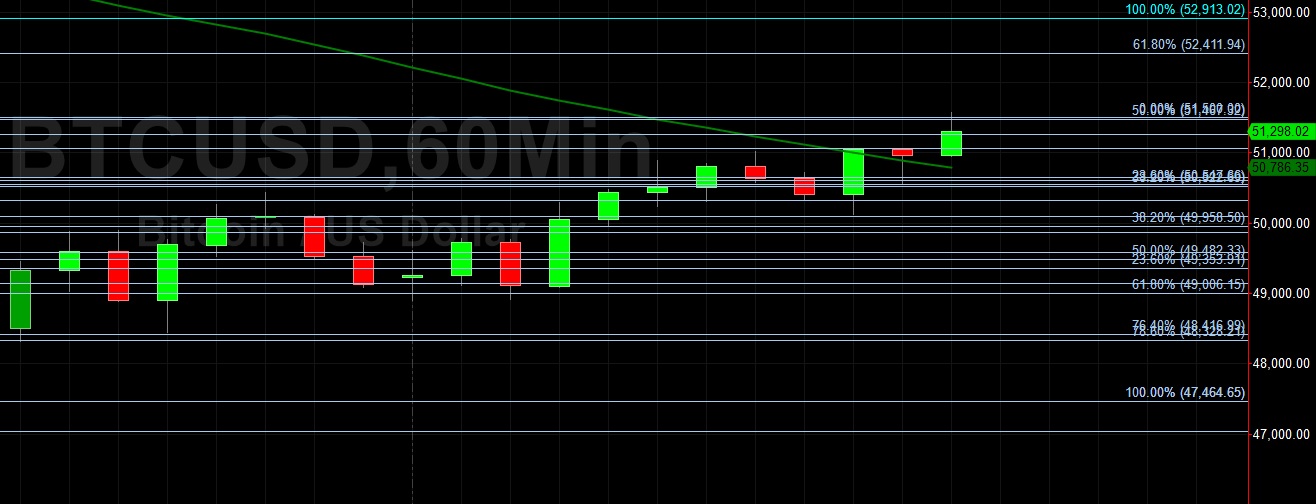
Price activity is nearest the 50-bar MA (4-hourly) at 55604.43 and the 50-bar MA (Hourly) at 50786.85.
Technical Support is expected around 45574/ 43406.42/ 41851.15 with Stops expected below.
Technical Resistance is expected around 64899/ 66200/ 66739.76 with Stops expected above.
On 4-Hourly chart, SlowK is Bullishly above SlowD while MACD is Bearishly below MACDAverage.
On 60-minute chart, SlowK is Bullishly above SlowD while MACD is Bullishly above MACDAverage.
Disclaimer: This trading analysis is provided by a third party, and for informational purposes only. It does not reflect the views of Crypto Daily, nor is it intended to be used as legal, tax, investment, or financial advice.