Ethereum (ETH/USD) moved higher early in the Asian session as the pair appreciated to the 2077.59 level after trading as low as the 1983.09 area during the North American session, with the interday high representing a test of the 61.8% retracement of the depreciating range from 2145 to 1980. Technical support emerged above the 1944 area earlier this week, a positive development for ETH/USD bulls given its previous technical significance as technical resistance. Light Stops were elected above the 2040.50 and 2066.58 levels during the ascent, representing the 50% and 61.8% retracements of the recent depreciating range from 2151 to 1930. Additional Stops are likely in place above the 2098.84 and 2103.71 levels. Notably, the recently-established all-time high of 2145 represented a test of the 2150.66 area, an upside price objective related to buying pressure around the 310.79 area.
If ETH/USD extends its upward strength, additional upside price objectives include the 2210.42 and 2460.24 levels. Below current market levels, some areas of potential technical support during pullbacks include 1932.59, 1906.64, 1859.89, 1822.11, 1764.32, 1737.57, and 1730.52. Beyond those levels, additional areas of technical support include 1403.13, 1296.30, and 1205.96. Traders are observing that the 50-bar MA (4-hourly) is bullishly indicating above the 100-bar MA (4-hourly) and above the 200-bar MA (4-hourly). Also, the 50-bar MA (hourly) is bearishly indicating below the 100-bar MA (hourly) and above the 200-bar MA (hourly).
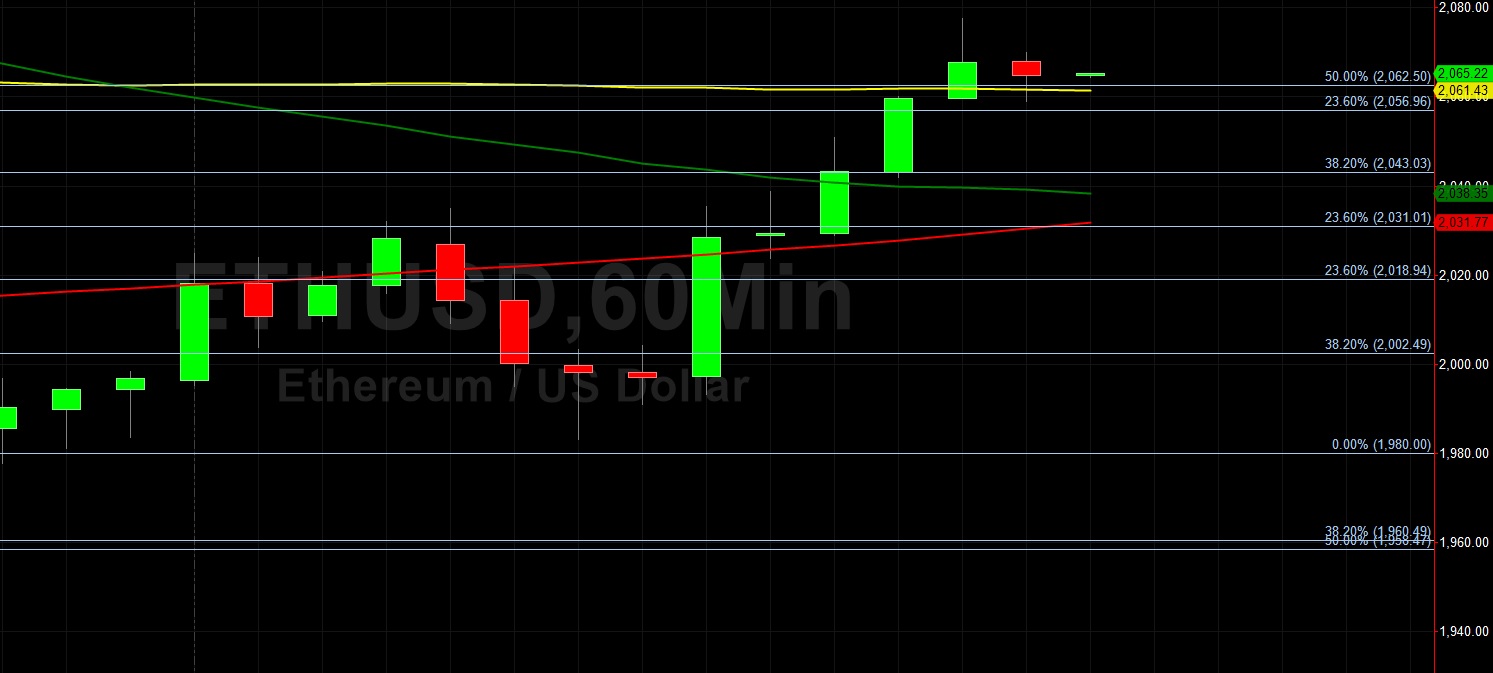
Price activity is nearest the 50-bar MA (4-hourly) at 2033.86 and the 100-bar MA (Hourly) at 2061.63.
Technical Support is expected around 1285.87/ 1205.96/ 1128.29 with Stops expected below.
Technical Resistance is expected around 2150.66/ 2210.42/ 2460.24 with Stops expected above.
On 4-Hourly chart, SlowK is Bullishly above SlowD while MACD is Bearishly below MACDAverage.
On 60-minute chart, SlowK is Bearishly below SlowD while MACD is Bullishly above MACDAverage.
Disclaimer: This trading analysis is provided by a third party, and for informational purposes only. It does not reflect the views of Crypto Daily, nor is it intended to be used as legal, tax, investment, or financial advice.