Ethereum (ETH/USD) scored gains early in the Asian session as the pair appreciated to the 2258.14 level after trading as low as the 2041.01 area during the North American session, with the interday low representing a test of the 38.2% retracement of the depreciating range from 2145 to 1980. Traders pushed ETH/USD as low as the 2000 level during yesterday’s Asian session, representing a test of the 23.6% retracement of the appreciating range from 1292.76 to 2199.11. Stops were elected below the 2311.47, 2251.76, 2165.15, 2068.50, and 2046.89 levels during the pullback. Stops were recently elected above the 2460.24 area during the ascent, an upside price objective related to historic buying activity that emerged around the 215.16 level. Significant Stops were recently elected above many upside price objectives including 2150.66 and 2210.42, areas related to historical buying pressure around the 310.79 and 90 areas.
Additional upside price objectives include the 2585.62 and 2677.40 areas, levels related to previous buying pressure around the 176.43 and 148.08 levels. Potential technical support levels during pullbacks include the 1925.07, 1780.10, and 1758.25 areas. Traders are observing that the 50-bar MA (4-hourly) is bullishly indicating above the 100-bar MA (4-hourly) and above the 200-bar MA (4-hourly). Also, the 50-bar MA (hourly) is below indicating below the 100-bar MA (hourly) and above the 200-bar MA (hourly).
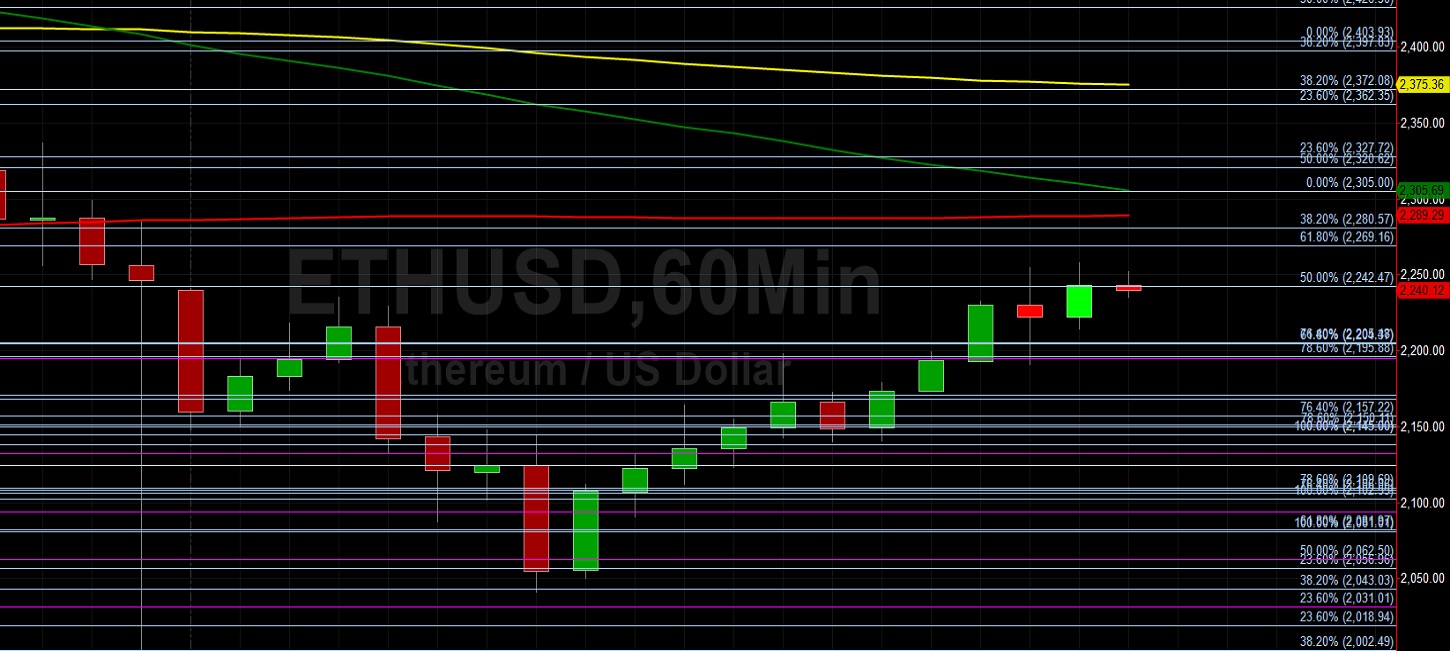
Price activity is nearest the 10-bar MA (4-hourly) at 2176.27 and the 200-bar MA (Hourly) at 2287.87.
Technical Support is expected around 1925.07/ 1780.10/ 1758.25 with Stops expected below.
Technical Resistance is expected around 2585.62/ 2677.40/ 2756.26 with Stops expected above.
On 4-Hourly chart, SlowK is Bearishly below SlowD while MACD is Bearishly below MACDAverage.
On 60-minute chart, SlowK is Bearishly below SlowD while MACD is Bearishly below MACDAverage.
Disclaimer: This trading analysis is provided by a third party, and for informational purposes only. It does not reflect the views of Crypto Daily, nor is it intended to be used as legal, tax, investment, or financial advice.