Ethereum (ETH/USD) glided higher early in the Asian session as the pair appreciated to the 2745.41 level after trading as low as the 2551 area during the European session, with the interday high representing a new lifetime high. Chartists observe the interday low represented a test of the 50-hour simple moving average. Also, the new lifetime high represents a test of the 2756.26 area, an upside price objective related to historic buying pressure around the 123.72 area. Stops were also recently elected above the 2677.40 area, an upside price objective related to buying pressure that commenced around the 148.08 area, and were also recently elected above the 2585.62 level that is related historic buying pressure around the 176.43 area. Stops were also elected above the 2417.77 and 2429.80 levels, representing the 76.4% and 78.6% retracements of the depreciating range from 2546.82 to 2000.
Significant Stops were also recently elected above many upside price objectives including 2150.66 and 2210.42, areas related to historical buying pressure around the 310.79 and 90 areas. Stops were recently elected below the 2311.47, 2251.76, 2165.15, 2068.50, and 2046.89 levels during the pullback. Additional upside price objectives include the 2756.26 and 2865.42 levels. Potential technical support levels during pullbacks include the 2506.50, 2420.08, and 2350.23 areas. Traders are observing that the 50-bar MA (4-hourly) is bullishly indicating above the 100-bar MA (4-hourly) and above the 200-bar MA (4-hourly). Also, the 50-bar MA (hourly) is bullishly indicating above the 100-bar MA (hourly) and above the 200-bar MA (hourly).
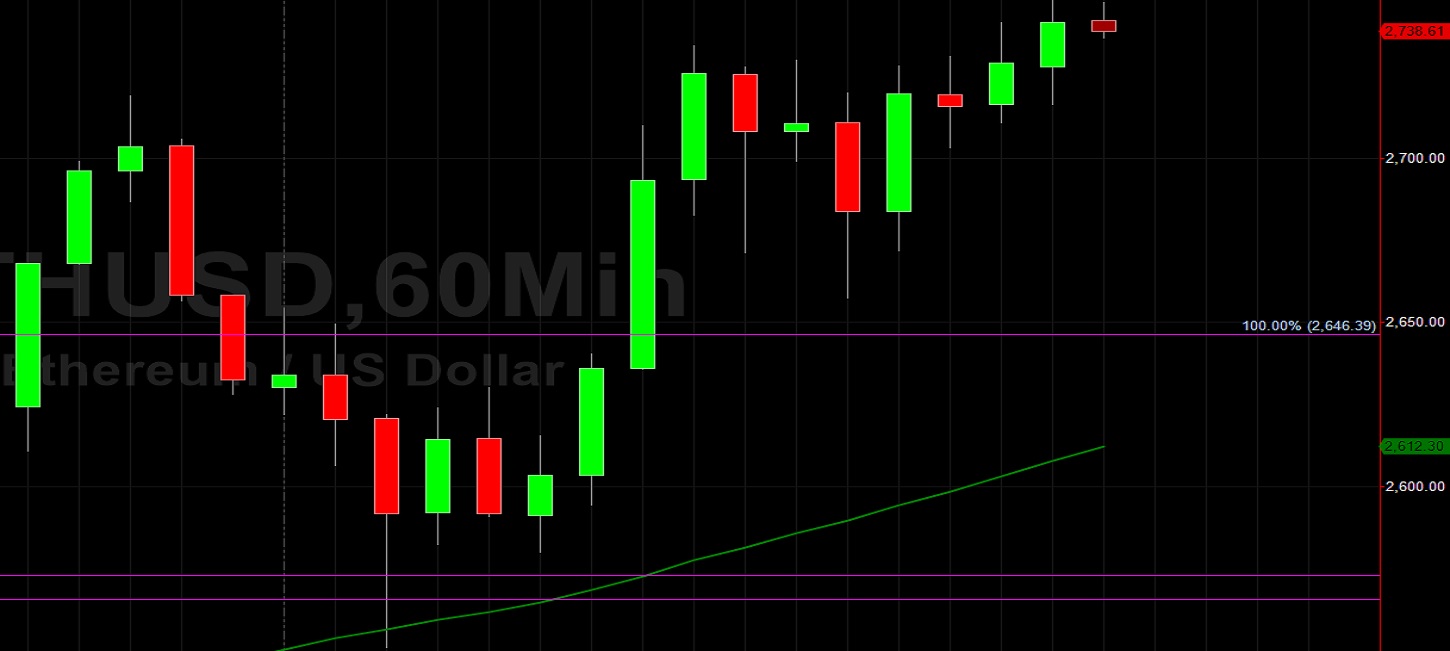
Price activity is nearest the 50-bar MA (4-hourly) at 2425.60 and the 50-bar MA (Hourly) at 2612.36.
Technical Support is expected around 1925.07/ 1780.10/ 1758.25 with Stops expected below.
Technical Resistance is expected around 2748.41/ 2756.26/ 2865.42 with Stops expected above.
On 4-Hourly chart, SlowK is Bullishly above SlowD while MACD is Bullishly above MACDAverage.
On 60-minute chart, SlowK is Bullishly above SlowD while MACD is Bullishly above MACDAverage.
Disclaimer: This trading analysis is provided by a third party, and for informational purposes only. It does not reflect the views of Crypto Daily, nor is it intended to be used as legal, tax, investment, or financial advice.