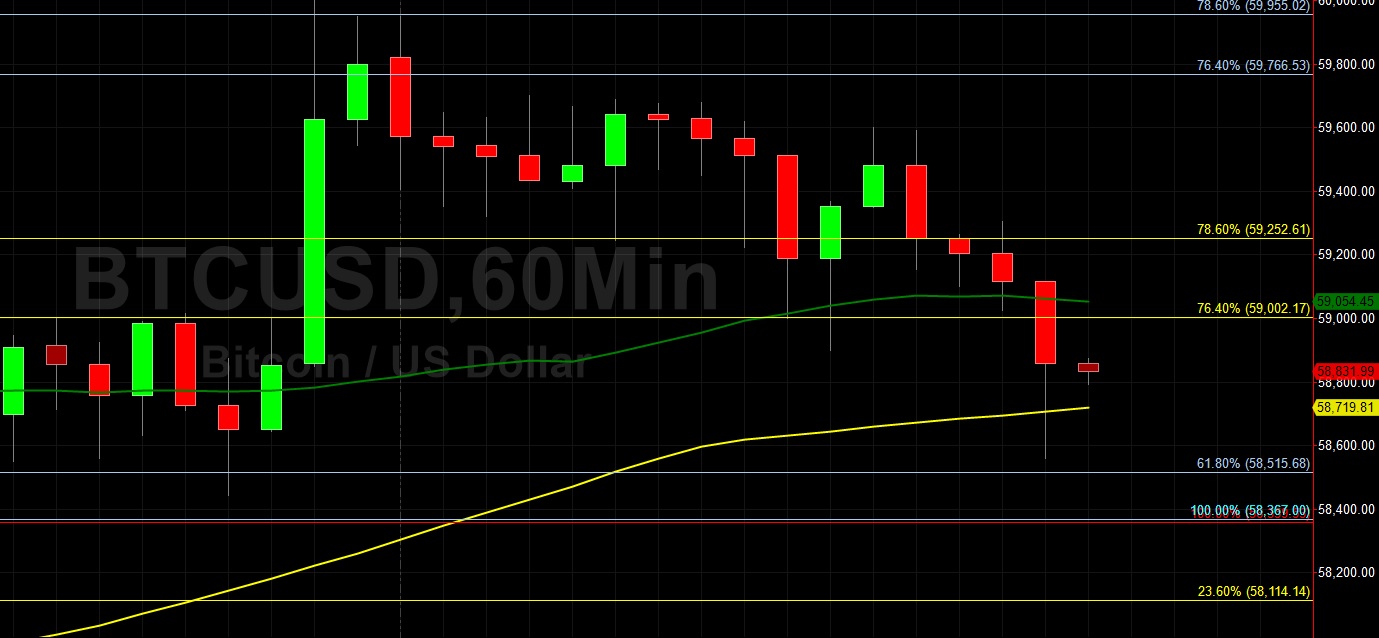
Bitcoin (BTC/USD) came off early in the Asian session as the pair depreciated to the 58560 area after trading as high as the 59948.50 level during the European session, with the interday high representing a test of the 78.6% retracement of the depreciating range from 61788.45 to 53221. Traders had earlier lifted BTC/USD to a multi-day high of 60055.02 before profit-taking commenced. Recent buying pressure pushed BTC/USD above the 52166, 54003, and 55841 areas, representing the 61.8%, 50%, and 38.2% retracements of the appreciating range from 46219.32 to 61788.45. If BTC/USD extends recent gains, additional upside price objectives include the 62026.52, 63788.17, 64436.39, and 64835.59 levels.
Stops were recently elected below the 52402, 52166, 52107, 51997, and 50485 levels during the depreciation. Following the recent weakness, some downside levels of potential technical support include 50187, 49962, 49551, 49322, 48972, and 48634. Traders have lifted BTC/USD more than 90% year-to-date, pushing the pair as high as the 61788.45 level, a fresh all-time high. Stops were recently elected above some important upside price objectives including the 58896.80, 59792.54, 60069.04, 60368.14, 60522.13, and 61065.64 areas, targets related to buying pressure from the 16200, 17580, 21913.84, and 9819.83 levels. Traders are observing that the 50-bar MA (4-hourly) is bullishly indicating above the 100-bar MA (4-hourly) and above the 200-bar MA (4-hourly). Also, the 50-bar MA (hourly) is bullishly indicating above the 100-bar MA (hourly) and above the 200-bar MA (hourly).
Price activity is nearest the 50-bar MA (4-hourly) at 56892.79 and the 100-bar MA (Hourly) at 58719.74.
Technical Support is expected around 50187/ 49962/ 49551 with Stops expected below.
Technical Resistance is expected around 62026.52/ 63788.17/ 64436.39 with Stops expected above.
On 4-Hourly chart, SlowK is Bearishly below SlowD while MACD is Bearishly below MACDAverage.
On 60-minute chart, SlowK is Bearishly below SlowD while MACD is Bearishly below MACDAverage.
Disclaimer: This trading analysis is provided by a third party, and for informational purposes only. It does not reflect the views of Crypto Daily, nor is it intended to be used as legal, tax, investment, or financial advice.