Ethereum (ETH/USD) was driven lower early in today’s Asian session as the pair depreciated to the 1800.55 area after trading as high as the 1840.69 area during the North American session. Traders have lifted ETH/USD more than 140% year-to-date, pushing the pair as high as the 2041.42 level, a fresh all-time high. The 1702.67 level emerged as important technical support after the all-time high was recently established, a level that represents the 61.8% retracement of the appreciating range from 1493.28 to 2041.42. Additional downside retracement levels in that appreciating range include 1622.64 and 1610.58. Stops were elected above the 1881.21 level during ETH/USD’s recent appreciation, representing the 78.6% retracement of the depreciating range from 2041.42 to 1292.76.
If ETH/USD extends its upward strength, additional upside price objectives include the 2080.48, 2134.98, 2150.66, and 2210.42 levels. Stops were also recently elected above the 1930.40, 1957.36, and 2017.05 levels during the appreciation, areas related to historical buying pressure around the 215.16, 370.50, and 176.43 areas. Some areas of potential technical support during pullbacks include 1403.13, 1205.96, and 1008.79, with stronger technical support likely in place around 1296.30 and 1066.14. Traders are observing that the 50-bar MA (4-hourly) is bullishly indicating above the 100-bar MA (4-hourly) and above the 200-bar MA (4-hourly). Also, the 50-bar MA (hourly) is bearishly indicating below the 200-bar MA (hourly) and above the 100-bar MA (hourly).
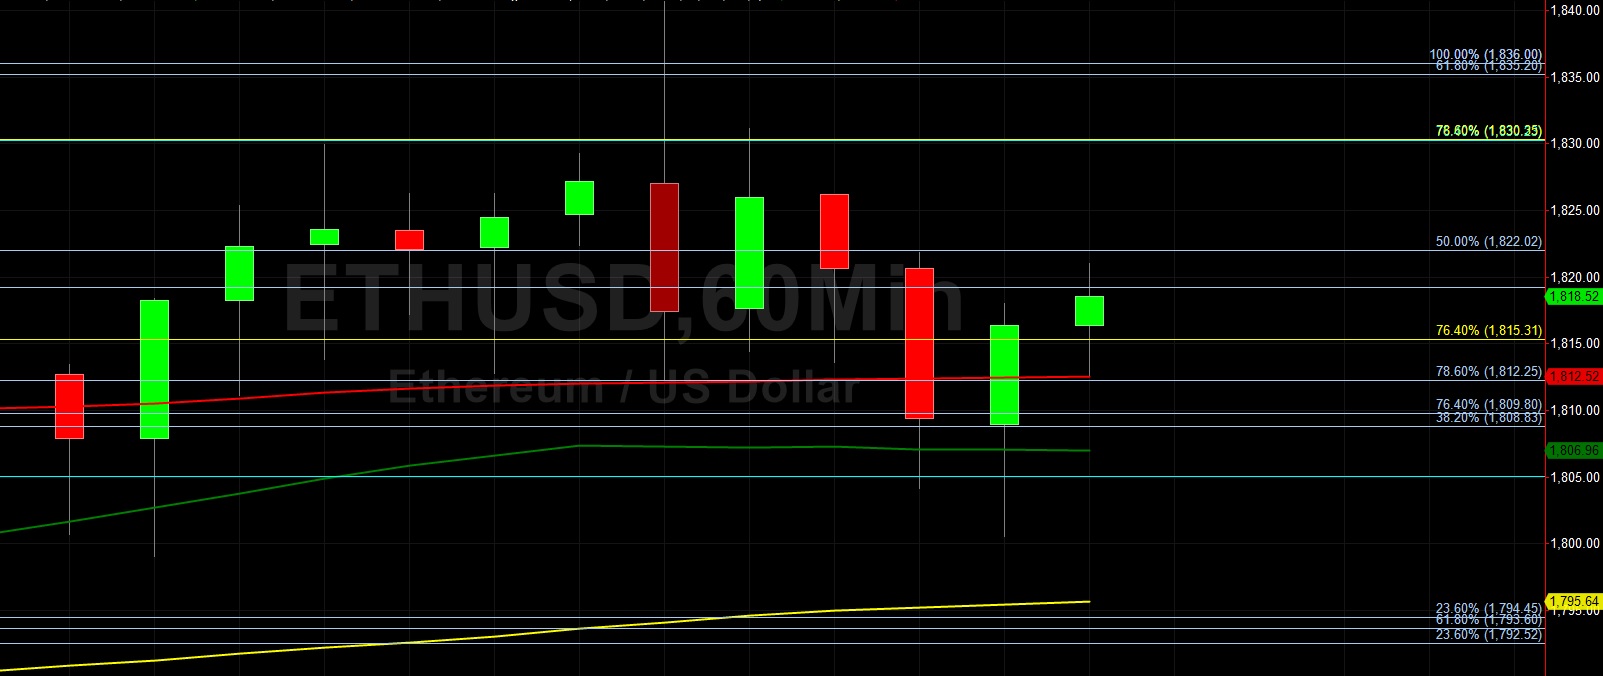
Price activity is nearest the 50-bar MA (4-hourly) at 1812.77 and the 200-bar MA (Hourly) at 1812.52.
Technical Support is expected around 1285.87/ 1205.96/ 1128.29 with Stops expected below.
Technical Resistance is expected around 2080.48/ 2134.98/ 2150.66 with Stops expected above.
On 4-Hourly chart, SlowK is Bearishly below SlowD while MACD is Bullishly above MACDAverage.
On 60-minute chart, SlowK is Bearishly below SlowD while MACD is Bearishly below MACDAverage.
Disclaimer: This trading analysis is provided by a third party, and for informational purposes only. It does not reflect the views of Crypto Daily, nor is it intended to be used as legal, tax, investment, or financial advice.