Bitcoin (BTC/USD) weakened early in today’s Asian session as the pair depreciated to the 56260 area after trading as high as the 60100 area in the North American session. Buying pressure emerged around the 50% retracement of the recent depreciating range from 61788.45 to 53221, and Stops were elected above the 59766.53 and 59955.02 levels, representing the 76.4% and 78.6% retracements of the same depreciating range. Traders are paying close attention to see how sustainable this most recent break of the psychologically-important 60000 figure is by BTC/USD bulls. Stops were recently elected above some important upside price objectives including the 58896.80, 59792.54, 60069.04, 60368.14, 60522.13, and 61065.64 areas, targets related to buying pressure from the 16200, 17580, 21913.84, and 9819.83 levels.
If BTC/USD extends recent gains, additional upside price objectives include the 62026.52, 63788.17, 64436.39, and 64835.59 levels. Some areas of potential technical support during pullbacks include 53288.70, 52378.04, 52107.83, and 51997.03. Stronger technical support is likely in place around the 48030.38 and 46556.35 areas, with Stops likely in place below. Traders are observing that the 50-bar MA (4-hourly) is bullishly indicating above the 100-bar MA (4-hourly) and above the 200-bar MA (4-hourly). Also, the 50-bar MA (hourly) is bearishly indicating below the 200-bar MA (hourly) and above the 100-bar MA (hourly).
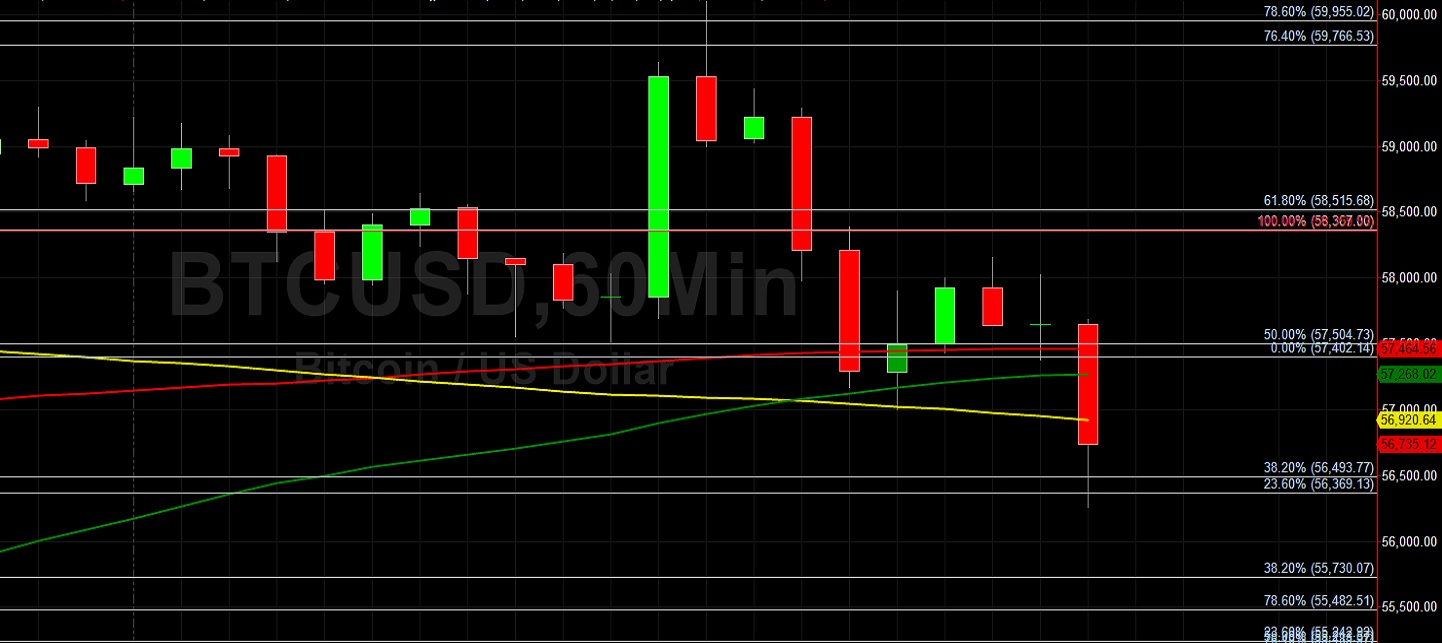
Price activity is nearest the 50-bar MA (4-hourly) at 57454.33 and the 200-bar MA (Hourly) at 57464.20.
Technical Support is expected around 53288.70/ 52378.04/ 52107.83 with Stops expected below.
Technical Resistance is expected around 62026.52/ 63788.17/ 64436.39 with Stops expected above.
On 4-Hourly chart, SlowK is Bearishly below SlowD while MACD is Bullishly above MACDAverage.
On 60-minute chart, SlowK is Bearishly below SlowD while MACD is Bearishly below MACDAverage.
Disclaimer: This trading analysis is provided by a third party, and for informational purposes only. It does not reflect the views of Crypto Daily, nor is it intended to be used as legal, tax, investment, or financial advice.