BTC/USD Peaks Above 54225 on Rebound: Sally Ho's Technical Analysis 27 March 2021 BTC
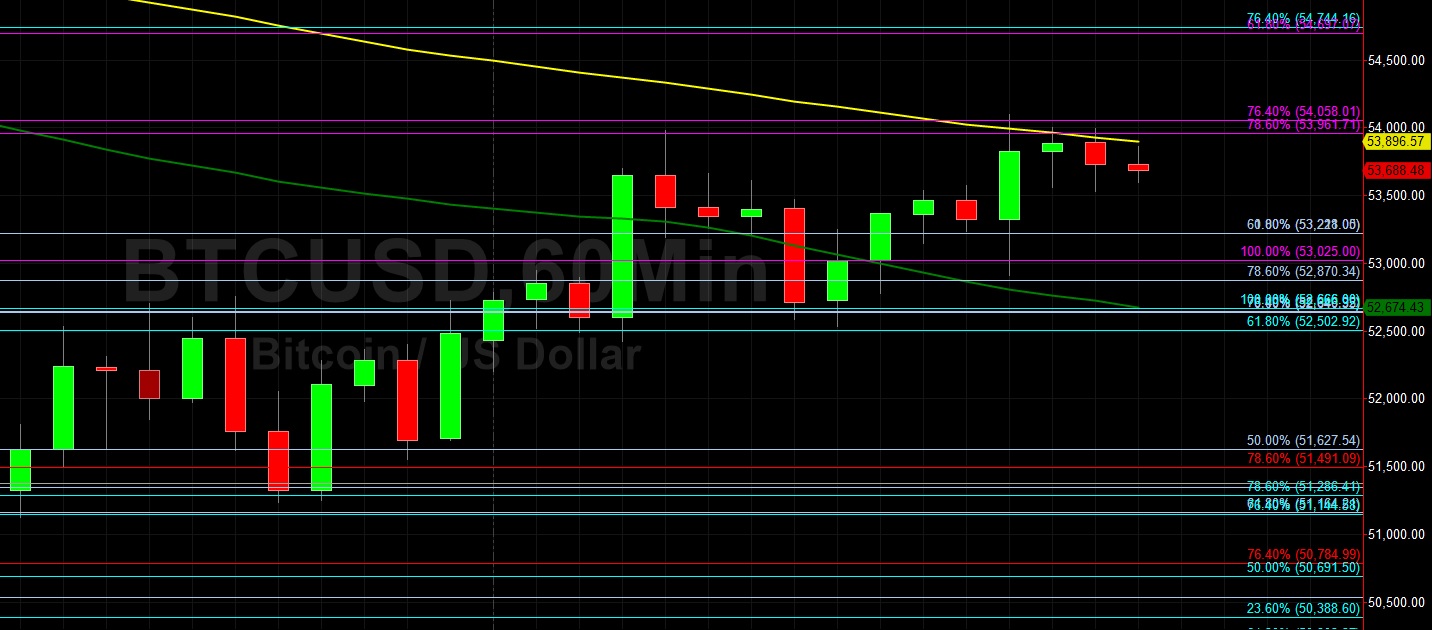
Bitcoin (BTC/USD) gained ground early in the Asian session as the pair appreciated to the 54096.27 level after trading as low as the 52200 level during the European session, with the interday high representing a test of the 76.4% retracement of the appreciating range from 53025 to 57402.14. A pullback during the North American session saw buying pressure keep BTC/USD bid above the 52502.92 area, representing the 61.8% retracement of the depreciating range from 58367 to 43016. Stops were elected below the 52402, 52166, 52107, 51997, and 50485 levels during the recent tumble. Following the recent weakness, some downside levels of potential technical support include 50187, 49962, 49551, 49322, 48972, and 48634. Traders have lifted BTC/USD more than 90% year-to-date, pushing the pair as high as the 61788.45 level, a fresh all-time high.
Stops were recently elected above some important upside price objectives including the 58896.80, 59792.54, 60069.04, 60368.14, 60522.13, and 61065.64 areas, targets related to buying pressure from the 16200, 17580, 21913.84, and 9819.83 levels. If BTC/USD extends recent gains, additional upside price objectives include the 62026.52, 63788.17, 64436.39, and 64835.59 levels. Traders are observing that the 50-bar MA (4-hourly) is bearishly indicating below the 100-bar MA (4-hourly) and above the 200-bar MA (4-hourly). Also, the 50-bar MA (hourly) is bearishly indicating below the 100-bar MA (hourly) and below the 200-bar MA (hourly).
Price activity is nearest the 200-bar MA (4-hourly) at 53104.01 and the 100-bar MA (Hourly) at 53895.89.
Technical Support is expected around 50187/ 49962/ 49551 with Stops expected below.
Technical Resistance is expected around 62026.52/ 63788.17/ 64436.39 with Stops expected above.
On 4-Hourly chart, SlowK is Bullishly above SlowD while MACD is Bullishly above MACDAverage.
On 60-minute chart, SlowK is Bearishly below SlowD while MACD is Bullishly above MACDAverage.
Disclaimer: This trading analysis is provided by a third party, and for informational purposes only. It does not reflect the views of Crypto Daily, nor is it intended to be used as legal, tax, investment, or financial advice.

Related Stories