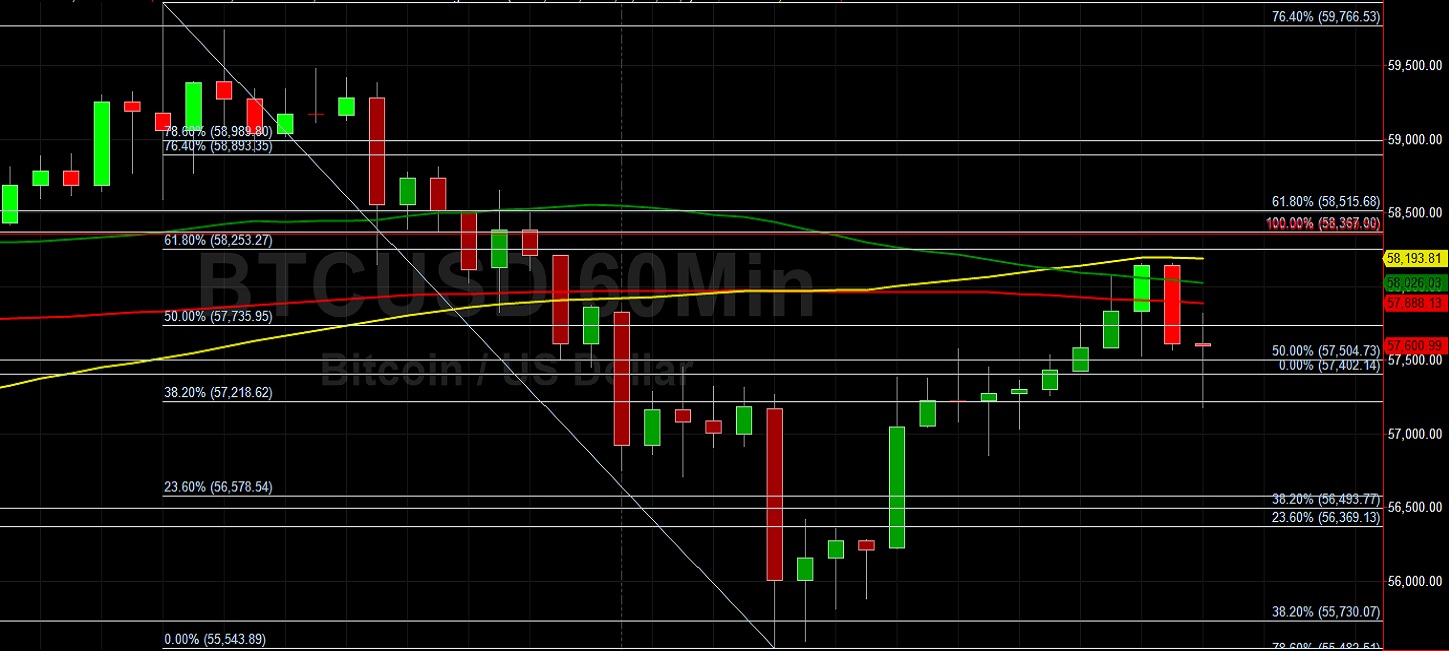
Bitcoin (BTC/USD) moved higher early in the Asian session as the pair appreciated to the 58158.41 level after trading as low as the 55543.89 level during the European session, with the intraday high representing a test of the 100-hour simple moving average, and the 61.8% retracement of the recent depreciating range from 59928 to 55543.99. Chartists note the interday low represents a test of the 78.6% retracement of the depreciating range from 58367 to 44888.08. Traders have lifted BTC/USD more than 95% year-to-date, pushing the pair as high as the 61788.45 level, a fresh all-time high. The 53288.70 area emerged as important technical support after the all-time high was recently established, a level that represents the 23.6% retracement of the appreciating range from 25772.55 to 61788.45. Additional downside retracement levels in this appreciating range that represent potential technical support include 48030.38 and 43780.50.
Stops were recently elected above some important upside price objectives including the 58896.80, 59792.54, 60069.04, 60368.14, 60522.13, and 61065.64 areas, targets related to buying pressure from the 16200, 17580, 21913.84, and 9819.83 levels. If BTC/USD extends recent gains, additional upside price objectives include the 62026.52, 63788.17, 64436.39, and 64835.59 levels. Some additional areas of potential technical support during pullbacks include 53288.70, 52378.04, 52107.83, and 51997.03. Traders are observing that the 50-bar MA (4-hourly) is bullishly indicating above the 100-bar MA (4-hourly) and above the 200-bar MA (4-hourly). Also, the 50-bar MA (hourly) is bearishly indicating below the 100-bar MA (hourly) and above the 200-bar MA (hourly).
Price activity is nearest the 50-bar MA (4-hourly) at 57879.88 and the 200-bar MA (Hourly) at 57887.87.
Technical Support is expected around 53288.70/ 52378.04/ 52107.83 with Stops expected below.
Technical Resistance is expected around 62026.52/ 63788.17/ 64436.39 with Stops expected above.
On 4-Hourly chart, SlowK is Bullishly above SlowD while MACD is Bearishly below MACDAverage.
On 60-minute chart, SlowK is Bearishly below SlowD while MACD is Bullishly above MACDAverage.
Disclaimer: This trading analysis is provided by a third party, and for informational purposes only. It does not reflect the views of Crypto Daily, nor is it intended to be used as legal, tax, investment, or financial advice.