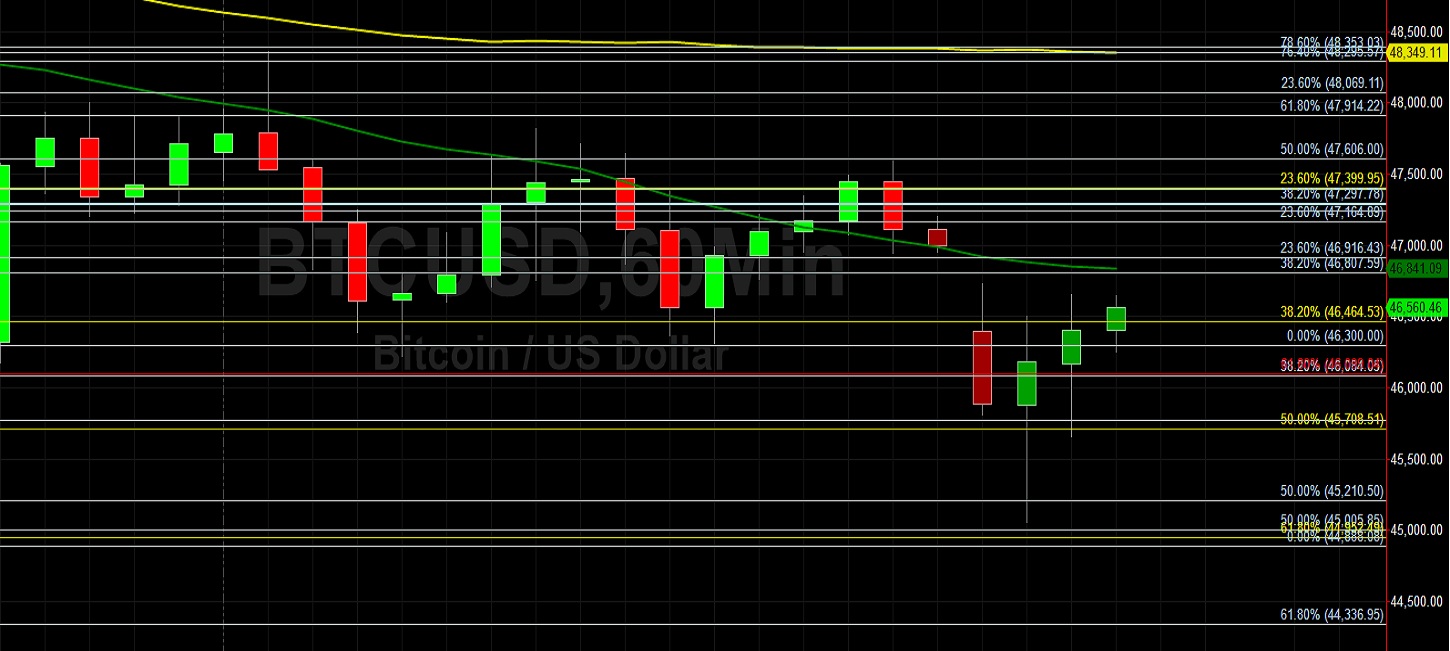
Bitcoin (BTC/USD) moved higher early in today’s Asian session as the pair appreciated to the 46656 area after trading as low as the 45055 area earlier in the Asian session, with the intraday low representing a test of the 50% retracement of the appreciating range from 37371.35 to 52640.35. Traders had earlier pushed the pair as high as the 48356.86 level during the European session, right around the 78.6% retracement of the depreciating range from 48912 to 46300. Traders are waiting to see if BTC/USD will again test the psychologically-important 50000 figure. Stops were recently elected below a series of downside retracement levels including 51473.20, 50674.71, 49674.05, 48741.27, 48371.21, and 47208.40. If BTC/USD extends its move lower, traders will pay close attention to potential areas of technical support including 44441.89, 43761.50, 42786.36, 42259.21, and 41537.23.
Stops were recently elected above many significant technical levels during the latest move to a new all-time high, including the 51732.54, 52505.24, 53194.95, 53276.47, 54400, 55266.17, 55715.92, 56761.65, and 57427.73 levels. These areas relate to historical buying pressure around the 17580, 21913.84, 27678, 16200, 27678, 21913.84, and 9819.83 levels. If BTC/USD continues its upward strength, traders will focus on upside price objectives including the 58896.80, 59724.81, 59792.54, 60,069.04, 60368.14, 60522.13, and 61064.65 levels. Traders are observing that the 50-bar MA (4-hourly) is bullishly indicating above the 100-bar MA (4-hourly) and above the 200-bar MA (4-hourly). Also, the 50-bar MA (hourly) is bearishly indicating below the 100-bar MA (hourly) and below the 200-bar MA (hourly).
Price activity is nearest the 200-bar MA (4-hourly) at 43765.61 and the 50-bar MA (Hourly) at 46841.28.
Technical Support is expected around 44441.89/ 43761.50/ 42786.36 with Stops expected below.
Technical Resistance is expected around 58896.80/ 59724.81/ 59792.54 with Stops expected above.
On 4-Hourly chart, SlowK is Bullishly above SlowD while MACD is Bullishly above MACDAverage.
On 60-minute chart, SlowK is Bullishly above SlowD while MACD is Bearishly below MACDAverage.
Disclaimer: This trading analysis is provided by a third party, and for informational purposes only. It does not reflect the views of Crypto Daily, nor is it intended to be used as legal, tax, investment, or financial advice.