Ethereum (ETH/USD) extended recent gains early in today’s North American session as the pair appreciated to the 1240.59 area after trading as low as the 1135.88 area in the Asian session, representing a test of the 50% retracement of the recent appreciating range from 975.00 to 1291.94. Chartists observe that today’s intraday high represents a test of the 23.6% retracement of the appreciating range from 1058.32 to 1291.94. Buying demand again showed up below the 100-hour simple moving average. Stops were recently elected above the 1072.78, 1133.44, 1163.93, 1176.28, 1225.30, and 1230.73 areas during the pair’s ongoing climb, important upside price objectives related to historical buying pressure around the 215.16, 625.01, 370.50, 480.08, 530.32, and 310.79 areas. Strong Stops were recently elected above the 819.23, 877.81, and 879.23 levels during the sharp ascent, upside price objectives also related to previous buying activity around the 625.01 and 530.32 areas. Additional upside price objectives include the 1381.03, 1439.98, 1582.86, and 1665.31 areas.
Traders also note that sizable Stops were recently elected during the move higher above the 1103.87 area, a level that represents the 76.4% retracement of a historical depreciating range from 1419.96 to 80.60. Additional significant Stops were recently elected above the 615.19, 637.79, 668.87, 679.78, and 698.88 area during the march to successive multi-year highs, and traders are curious to see how supportive those levels become during pullbacks lower. Following the pair’s recent moves to successive multi-year highs, downside retracement levels and areas of potential technical support include the 1103.87, 1046.65, 1016.74, 993.65, 964.11, 930.68, and 902.22 levels. ETH/USD gained approximately 21% month-to-date in December, and closed 2020 with approximately a 450% gain. Traders are observing that the 50-bar MA (4-hourly) is bullishly indicating above the 100-bar MA (4-hourly) and above the 200-bar MA (4-hourly). Also, the 50-bar MA (hourly) is bullishly indicating above the 100-bar MA (hourly) and above the 200-bar MA (hourly).
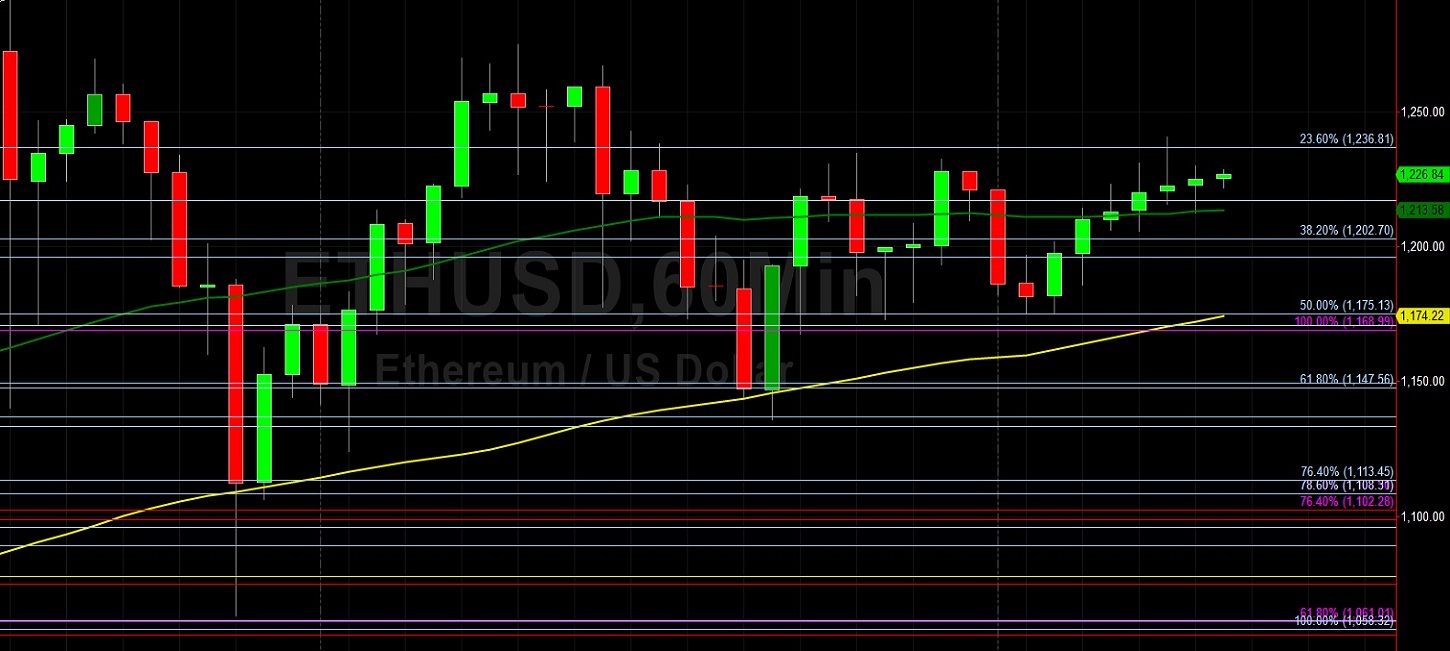
Price activity is nearest the 50-bar MA (4-hourly) at 1033.06 and the 50-bar MA (Hourly) at 1213.55.
Technical Support is expected around 792.40/ 766.54/ 729.88 with Stops expected below.
Technical Resistance is expected around 1275.00/ 1381.03/ 1439.98 with Stops expected above.
On 4-Hourly chart, SlowK is Bullishly above SlowD while MACD is Bearishly below MACDAverage.
On 60-minute chart, SlowK is Bearishly below SlowD while MACD is Bullishly above MACDAverage.
Disclaimer: This trading analysis is provided by a third party, and for informational purposes only. It does not reflect the views of Crypto Daily, nor is it intended to be used as legal, tax, investment, or financial advice.