ETH/USD Rallies to New Multi-Year High of 1234.12: Sally Ho's Technical Analysis 7 January 2021 ETH
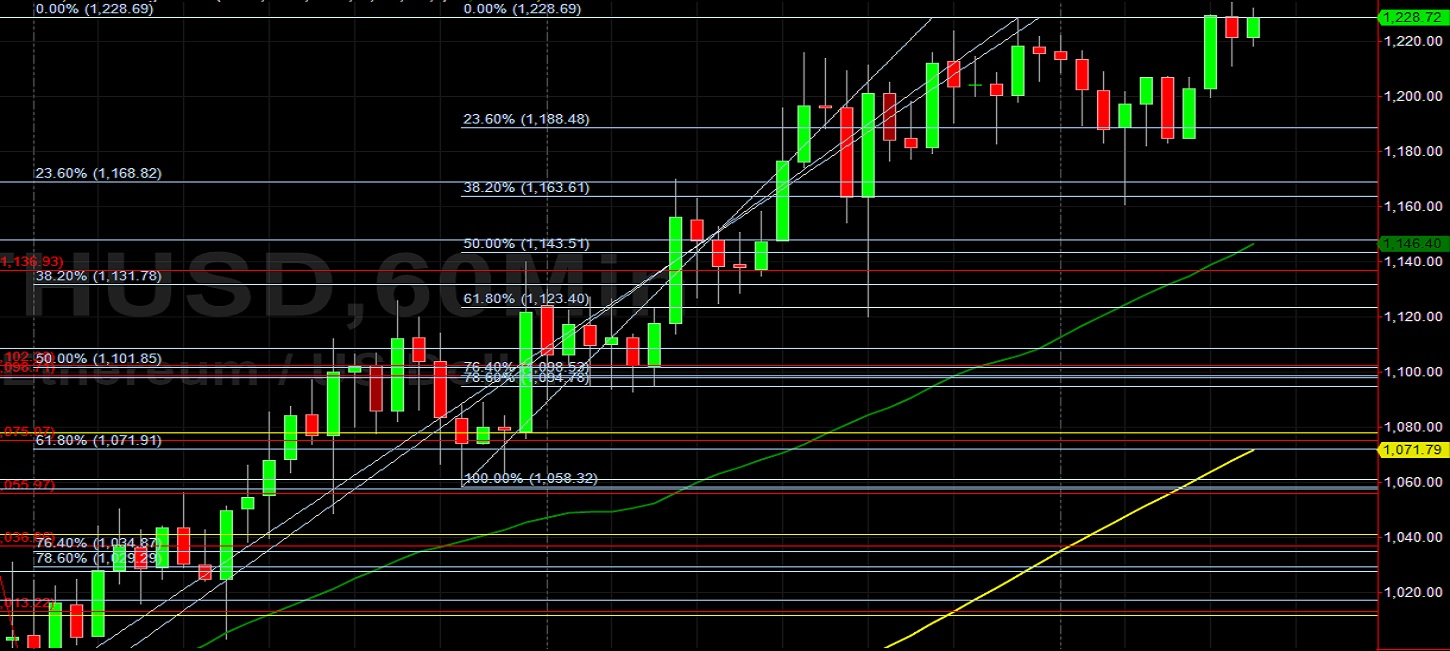
Ethereum (ETH/USD) moved higher early in today’s North American session as the pair appreciated to the 1234.12 area after trading as low as the 1160.71 area during the European session, with the intraday low representing a test of the 38.2% retracement of the recent appreciating range from 1058.32 to 1228.69. Stops were recently elected above the 1072.78, 1133.44, 1163.93, 1176.28, 1225.30, and 1230.73 areas during the pair’s ongoing climb, important upside price objectives related to historical buying pressure around the 215.16, 625.01, 370.50, 480.08, 530.32, and 310.79 areas. Notably, a previous recent relative high of 1168.99 represented a test of another upside price objective, the 1163.93 area that became technically significant based on upside buying pressure that also emerged around the 370.50 area in 2020. Strong Stops were recently elected above the 819.23, 877.81, and 879.23 levels during the sharp ascent, upside price objectives also related to previous buying activity around the 625.01 and 530.32 areas. Additional upside price objectives include the 1239.06, 1381.03, 1439.98, 1582.86, and 1665.31 areas.
Traders also note that sizable Stops were elected during the move higher above the 1103.87 area, a level that represents the 76.4% retracement of a historical depreciating range from 1419.96 to 80.60. Additional significant Stops were recently elected above the 615.19, 637.79, 668.87, 679.78, and 698.88 area during the march to successive multi-year highs, and traders are curious to see how supportive those levels become during pullbacks lower. Following the pair’s recent moves to successive multi-year highs, downside retracement levels and areas of potential technical support include the 1103.87, 1046.65, 1016.74, 993.65, 964.11, 930.68, and 902.22 levels. ETH/USD gained approximately 21% month-to-date in December, and closed 2020 with approximately a 450% gain. Traders are observing that the 50-bar MA (4-hourly) is bullishly indicating above the 100-bar MA (4-hourly) and above the 200-bar MA (4-hourly). Also, the 50-bar MA (hourly) is bullishly indicating above the 100-bar MA (hourly) and above the 200-bar MA (hourly).
Price activity is nearest the 50-bar MA (4-hourly) at 919.46 and the 50-bar MA (Hourly) at 1146.44.
Technical Support is expected around 792.40/ 766.54/ 729.88 with Stops expected below.
Technical Resistance is expected around 1239.06/ 1381.03/ 1439.98 with Stops expected above.
On 4-Hourly chart, SlowK is Bullishly above SlowD while MACD is Bullishly above MACDAverage.
On 60-minute chart, SlowK is Bullishly above SlowD while MACD is Bearishly below MACDAverage.

Related Stories